Model structure 2: Worksheet level
Each column should have a purpose. That purpose should be the same across the workbook.
Each different sheet type in our model will have its own defined structure. In this chapter, we're going to look at the calculation sheets. Later we'll look at other sheet types.
If this approach to sheet structure seems to you to be overly prescriptive and rigid, I will encourage you to stick with it for now.
The structure of the workbook, and the modelling process that we are following rely on each another. The structure and the process form part of a combined system. All the pieces of that system work together to make your model clearer and make you more productive. You can always adapt it later to suit your needs better. Don't reject it now, just because it's different to how you might have approached it in the past.
The most important rule to follow when structuring worksheets is that each column has a defined purpose, and that purpose remains the same in all sheets of the same type.
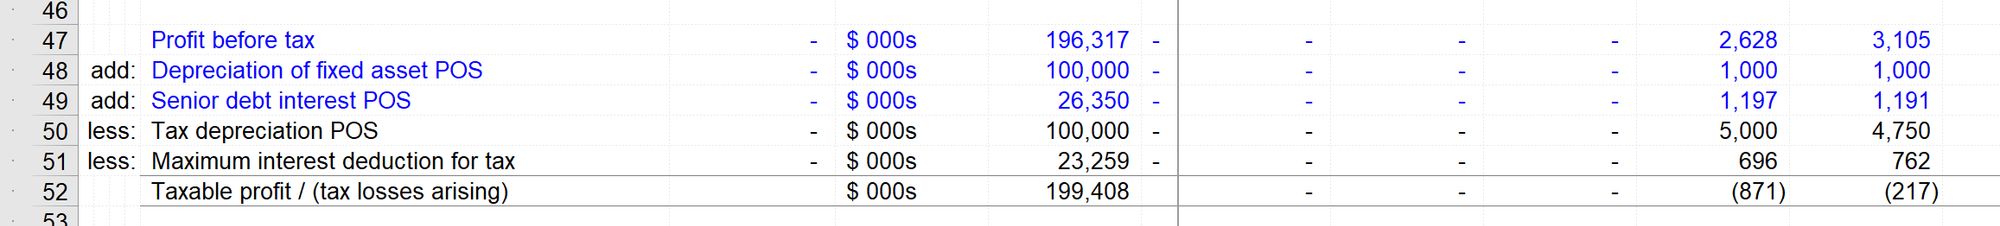
Here's a view of one of the case study models we will build as we work together through the book. It shows the structure that we apply to every calculation sheet in the model.
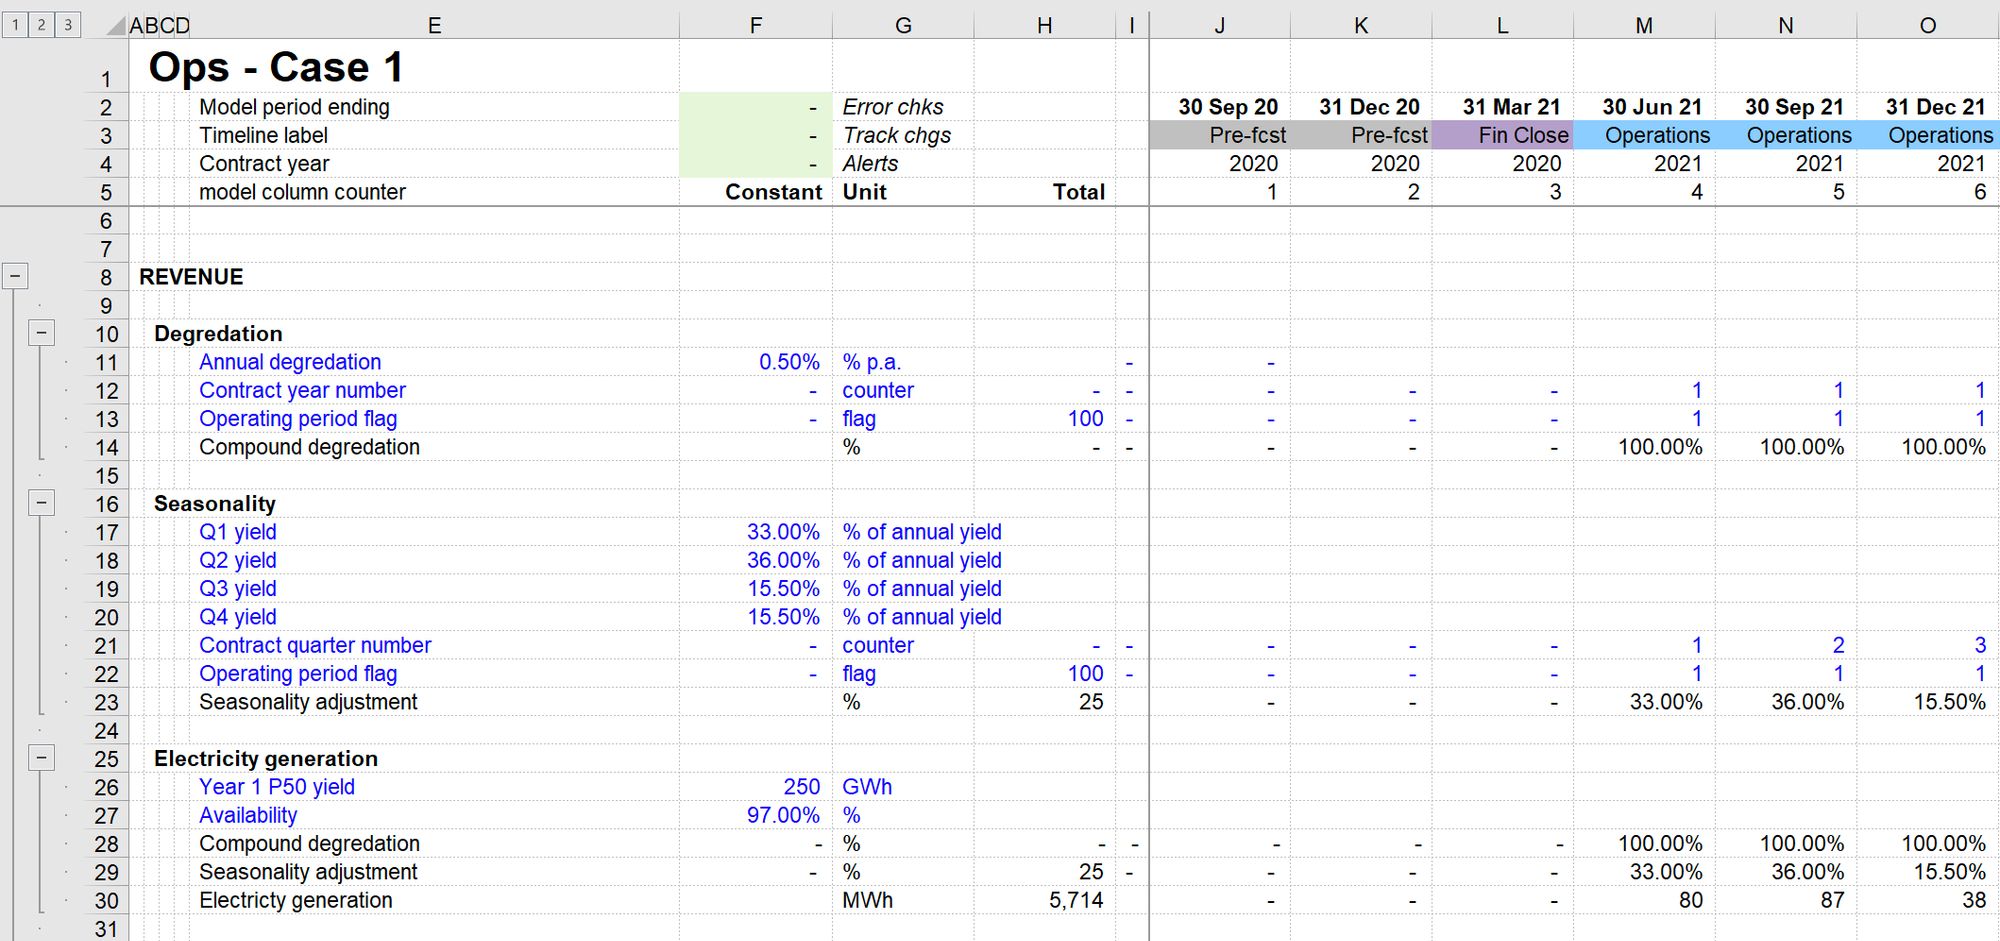
The following column structure is what we use in 99% of our models. We occasionally need to change it. Even when we change it - these essential column functions will still be present.
1 Model header structure
We usually keep a small number of consistent header rows above the freeze pane.
Model period ending
This is essential. Each column from J onwards represents a period of time. It’s essential to know what the period end date is of each column.
Timeline label
This is useful. The number of active columns usually exceeds the number being used. For example, we have some unused columns before and after the active timeline. These unused columns are helpful to allow dates to change in the model without having to restructure the entire timeline. For example, we often want to model extensions to operation periods and therefore some spare columns towards the end of the model are useful.
Contract year
Useful but not essential. Other time indicators could be used here - for example, contract year number. If not required, this can be removed from the header block.
Column number
This comes in useful to identify model column numbers when looking at a quick chart. See creating a quick chart using F11.
2 Column structure
Columns A-C - Headers
These four narrow columns to the left of the sheet are helpful. We use three of them for headers. Having dedicated columns gives us the following functional advantages:
- We can navigate up and down the sheet between sections (see the chapter on navigation)
- We can apply consistent formatting to the column. For example, we make Columns A & B bold and column C underlined. We use caps in column A. This gives a visual hierarchy to section headings.
- Section headings, sub-sections headings and sub-sub section headings have a natural indentation. This also contributes to a visual hierarchy.
At the end of each sheet, in column A, we add an "END" label to show that this is end of the worksheet. Some of the utility macros use that END market to limit the range of operation within the sheet.
Column D - Helper labels
Because we are working with a "positive as normal" sign convention (see the chapter "Stay positive"), it can be helpful to indicate when row items within a calculation block are being added and when they are being subtracted. We'll talk about this more when we come on to modelling balances.
Column E - Row label
Column E is much wider because labels need more text. Here are a few guidelines about row labels:
- They should be as descriptive as possible - making it clear to the reader of the model what the line item is.
- They should be unique - no two line items in your model should have the same name.
- They should be consistent. If you are modelling senior debt, stick to using senior debt in your labels. For example, don't have "Debt interest" and "Senior debt interest" when they refer to the same thing.
- They should work out of context. We will use links to "call up" line items that we are using in other calculations. Therefore don't call a line item "Balance" or "Interest". When this line item is used somewhere else in the model, it won't be clear which balance or interest on what.
Column F - Constants
As discussed previously, every line item in your model must be a constant or a time series. Constants are not related to a specific time period; time-series line items are. We, therefore, need a specific column for constants. As we progress through the model build, you'll see how useful this is.
Column F is also used to show sparklines. See here for more on sparklines.
Column G - Units
Every line item has units. It's helpful, therefore, to have a dedicated column for them. We will often have a "Standard Monetary Unit" that we use in the model. This is the default currency unit used most often throughout the model. The financial statements will be presented in the Standard Monetary Unit. See more about using a Standard Monetary Unit here.
Column H - Row total
It's helpful to see the row total for flows. It isn't beneficial to see this for balances. Ctrl+Shift+n will add a row total automatically.
Column I - Spacer column
The requirement to "look back one period" comes up frequently in models. This spacer column is a simple way of avoiding quite a lot of formula complexity later. We'll see this when we look at balances.
Column J onwards
Column J is the first of our time-based columns. Each column from J onwards will represent the same amount of time. If our model is monthly, each column will represent one month. It's essential that this is common across all calculation sheets of your model, or else you will be in a world of pain and error. On occasion, particularly in Project Finance models, we will have two timelines. The principle still stands - all the monthly construction sheets have a standard timeline, and all the operational sheets, which may be quarterly or semi-annual, have a standard timeline.
Next, we'll look at how to deal with the columns after the end of our timeline.

Comments
Sign in or become a Financial Modelling Handbook member to join the conversation.
Just enter your email below to get a log in link.