Output sheet structure
The Output sheet is the most useful sheet in the financial model.
Its purpose is to help you answer two critical analytical questions:
- What changed?
- Why did it change?
Having absolute clarity over what has changed in the outputs of your model as a consequence of changes you make to the inputs or calculations is a game-changer.
Tracking these differences allows you to report changes and differences with confidence and, as importantly, dig into why those changes have occurred.
It also allows you to assess if the model reacts in line with your expectations. (In a later chapter, we'll discuss why you should always have a hypothesis about how your model will respond when you make a change).
For example, if you change revenue, you might expect tax to change as a result. If that doesn't happen or happens by a different amount or in a different direction than you expected, either you don't understand the tax treatment, or the model is wrong.
The Output sheet is a functional, analytical tool. It is NOT a data presentation tool. Nor is it a "Dashboard".
The Output sheet has been designed to allow you to compare the live outputs of the model, given the current input and calculation structures, with previously stored sets of outputs.
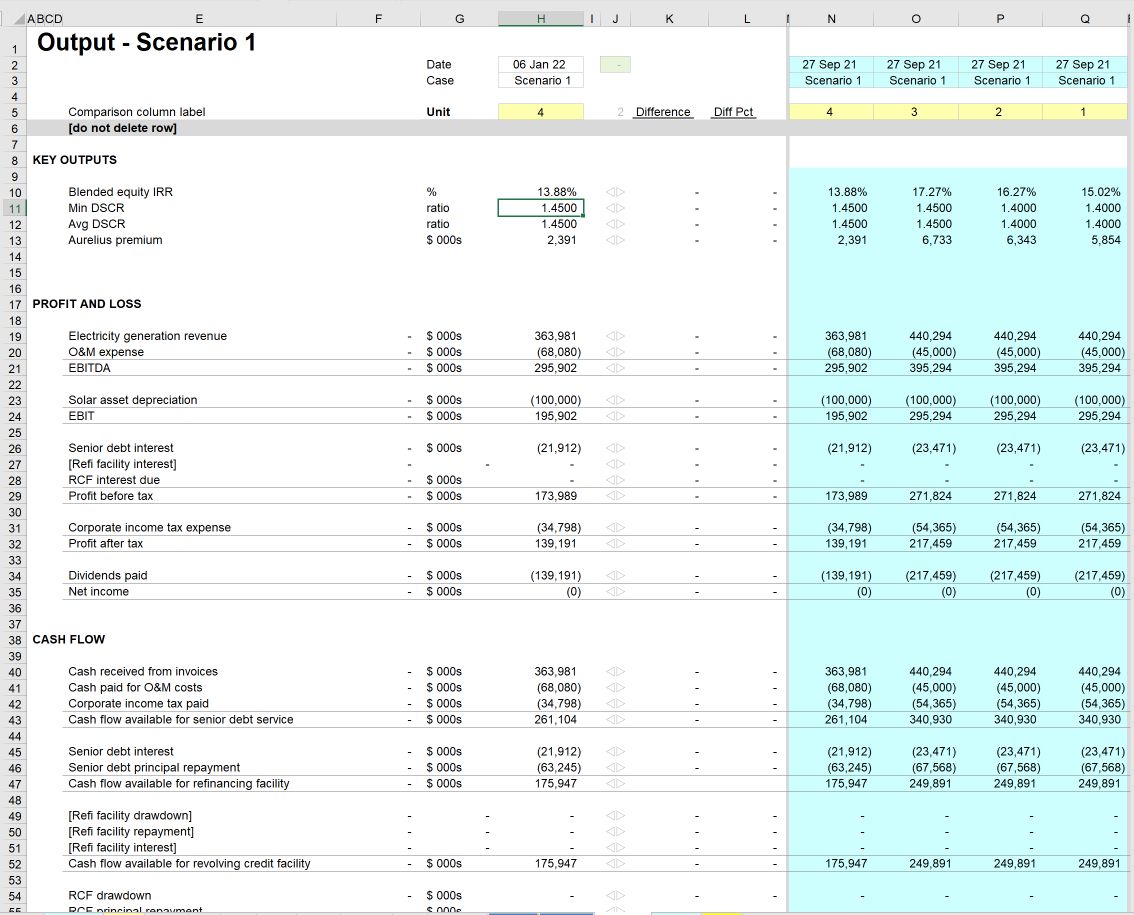
The above is an example Output sheet from a developed model. Don't worry that you don't yet "have" this model. We'll get to that point in the Case Study model build in Part 3.
Choosing the comparison case
The Output sheet compares the live output values from the model with a set of "stored" values from a previous model run.
We often end up with dozens of stored output cases, especially when we are running a lot of sensitivities to support decision making.
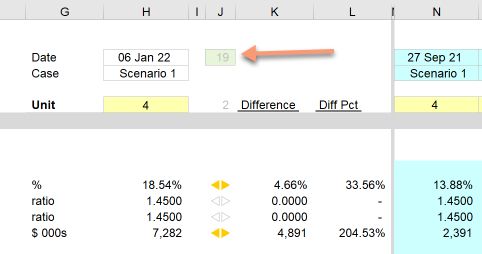
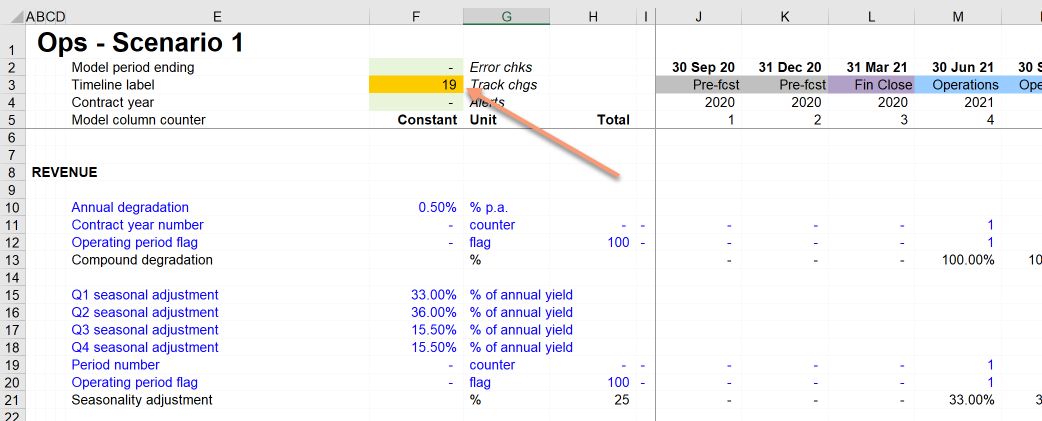
Each stored output case has a unique, sequential number. The input in Cell H5 selects the stored output case for the Output sheet to compare with the current live outputs.
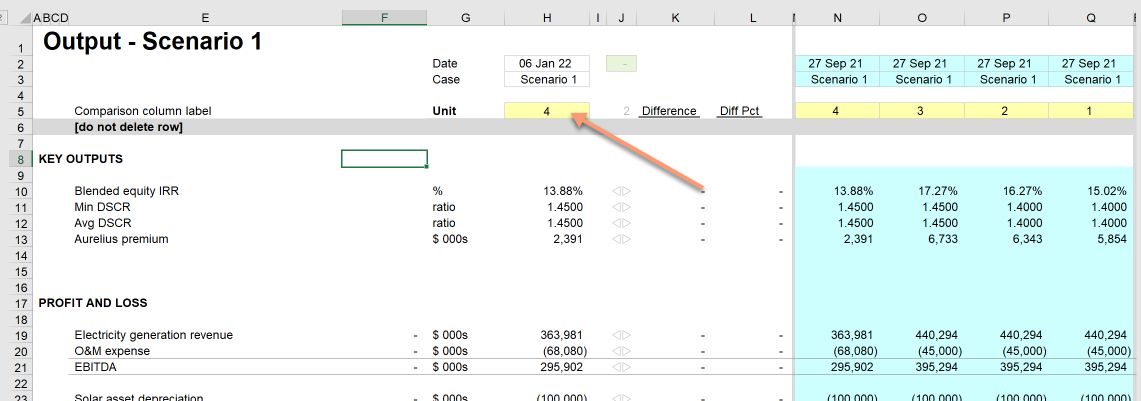
In the model shown above, there are no differences between the live outputs and stored output set 4.
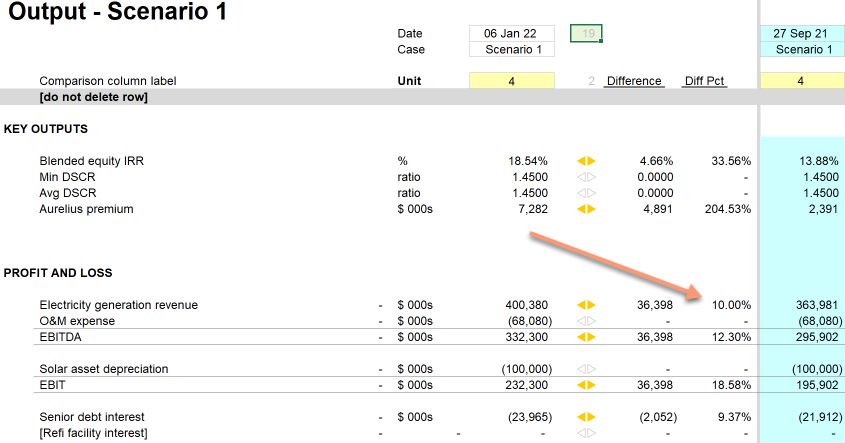
If we make a change to the inputs of this model, for example, increasing revenue, some differences will appear:
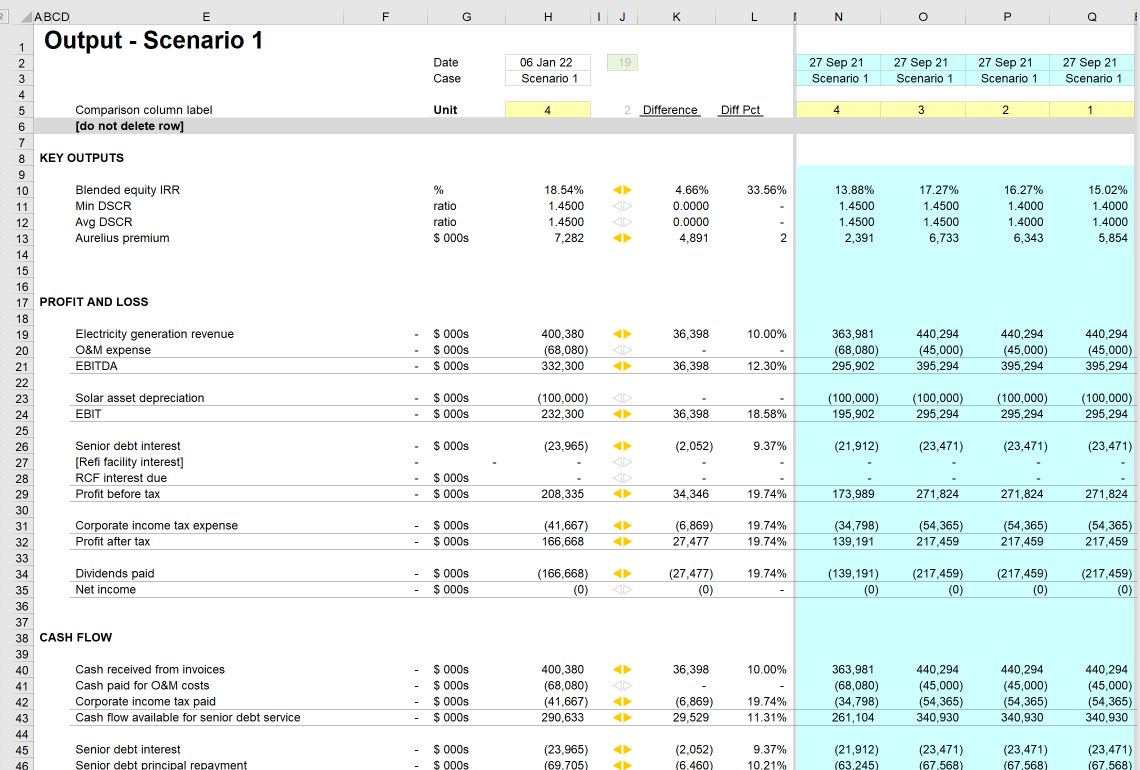
We have increased revenue by 10%, resulting in several differences between the live outputs, and stored Output case 4.
Column structure of the Output sheet
Column E - H
This column contains links to useful / interesting / critical numbers in our model. A crucial part of the sheet design is that links have been structured so that all the metrics we want to track are in the same column.
Column J
This column contains a "difference alert marker", similar to the one seen on the Input sheet.
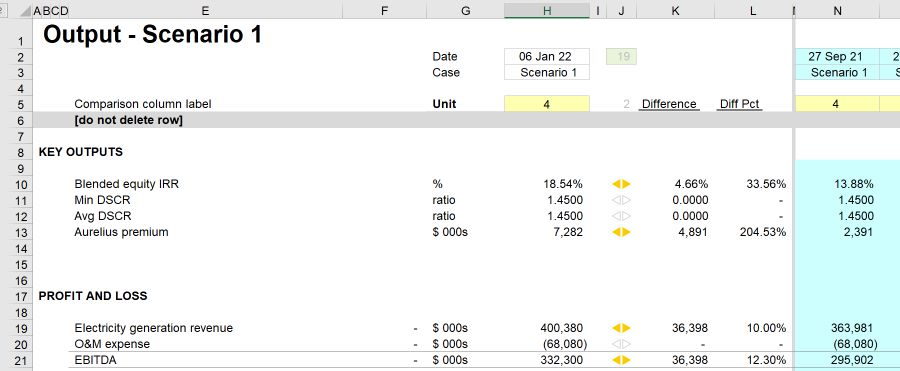
Columns K & L
This column K shows the difference between the live value and the selected stored value in absolute terms. Column L shows the difference in percentage terms.
We can see immediately from the difference marker that increasing revenue by 10% has caused the Blended equity IRR to increase, but not the DSCR. We can see that on the Income statement, revenue has increased, and EBITDA has increased, but that O&M and depreciation have not.
Reporting the number of differences
Cell J2 reports the total number of differences. This number is not particularly useful in itself, but it's certainly helpful to see when it is or is not zero.
We report this number in the header of every calculation sheet in the model. It's helpful to know that I have made a change that has caused the model to deviate from the most recent stored set of outputs.
The comfort of knowing that you are home again
A secondary benefit of the Output sheet is giving you the confidence that nothing has changed. As you change inputs or adapt calculations, it's incredibly valuable to look at the Output sheet and know for sure that the outputs are the same as they were before. This is a critical error management function.
What to include on the Output sheet.
As a minimum, we include the totals from the income statement and cash flow statement. It's helpful to see how each line item has moved. For example, when I changed the Electricity tariff input by 10%, revenue moved by 10%.
In Project & Structured Finance models, we also include the totals from the sources and uses of cash statements.
We would also include whichever key metrics are essential to the business or project. This is often IRRs, cover ratios, profitability metrics, cost of debt etc.
Storing a new output track.
The Productivity Pack macro set contains a shortcut for adding a stored output track.
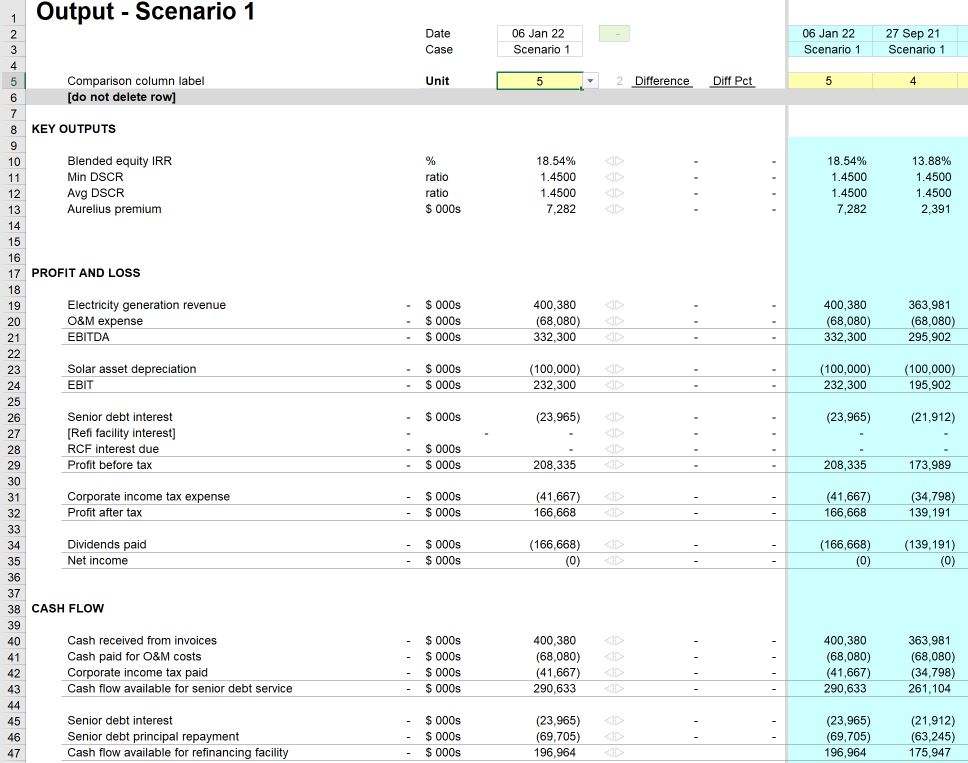
The macro will add the new output set to the left of the other stored results. The intention here is that the most recently stored output sets are the most visible on the left of the data set. Older stored output sets will progressively move to the right.
As you can see above, the macro has added a new output set and has given it the number five. All of the difference markers have reset since the live outputs align with the selected output set.
Note: The macro to add a set of output values requires several Named Ranged to be present in the sheet. See the Productivity Pack documentation in Appendix A for details. All of the example models used in the book already have the correct Named Ranges present.
Adding new metrics to the Output sheet
See Core Modelling Skill 12 on adding a new metric or value to the Output sheet.

Comments
Sign in or become a Financial Modelling Handbook member to join the conversation.
Just enter your email below to get a log in link.