Core modelling skill 12: How to track financial model outputs
The output sheet is an essential analytical tool.
However, some functional requirements of the sheet require us to "break structure" when it comes to linking.
The output sheet presents all live values in Column H. This gives a structured way to easily compare data sets and store multiple output sets for future comparison.
Some of the values we want to track on the Output sheet are row totals. Examples of this would be the totals from the Income and Cashflow Statements. These values are already in Column H. This makes the linking easy.
However, many of the values on the output sheet are constants, calculated in column F in the calculation sheets of our model. For these values, we have to rearrange the linked columns when adding these values to our output sheet.
In the same way, we automated input relocation, we have also automated adding values to the output sheet:
When relocating an input, you must position your cell section on the value you want to relocate. Similarly, with the output tracker, you must select the value you want to add to the output sheet.
You must, therefore, either select:
- A calculated constant in Column F or
- A row total in Column H
The macro will arrange the link structure accordingly and place the output track at the bottom of the output sheet.
Note: There are a number of range names you need to have on your output sheet for the macro to work. See here for details.
EXAMPLE
Download the example model to practice:
To obtain the worked example file to accompany this chapter buy the financial modelling handbook.
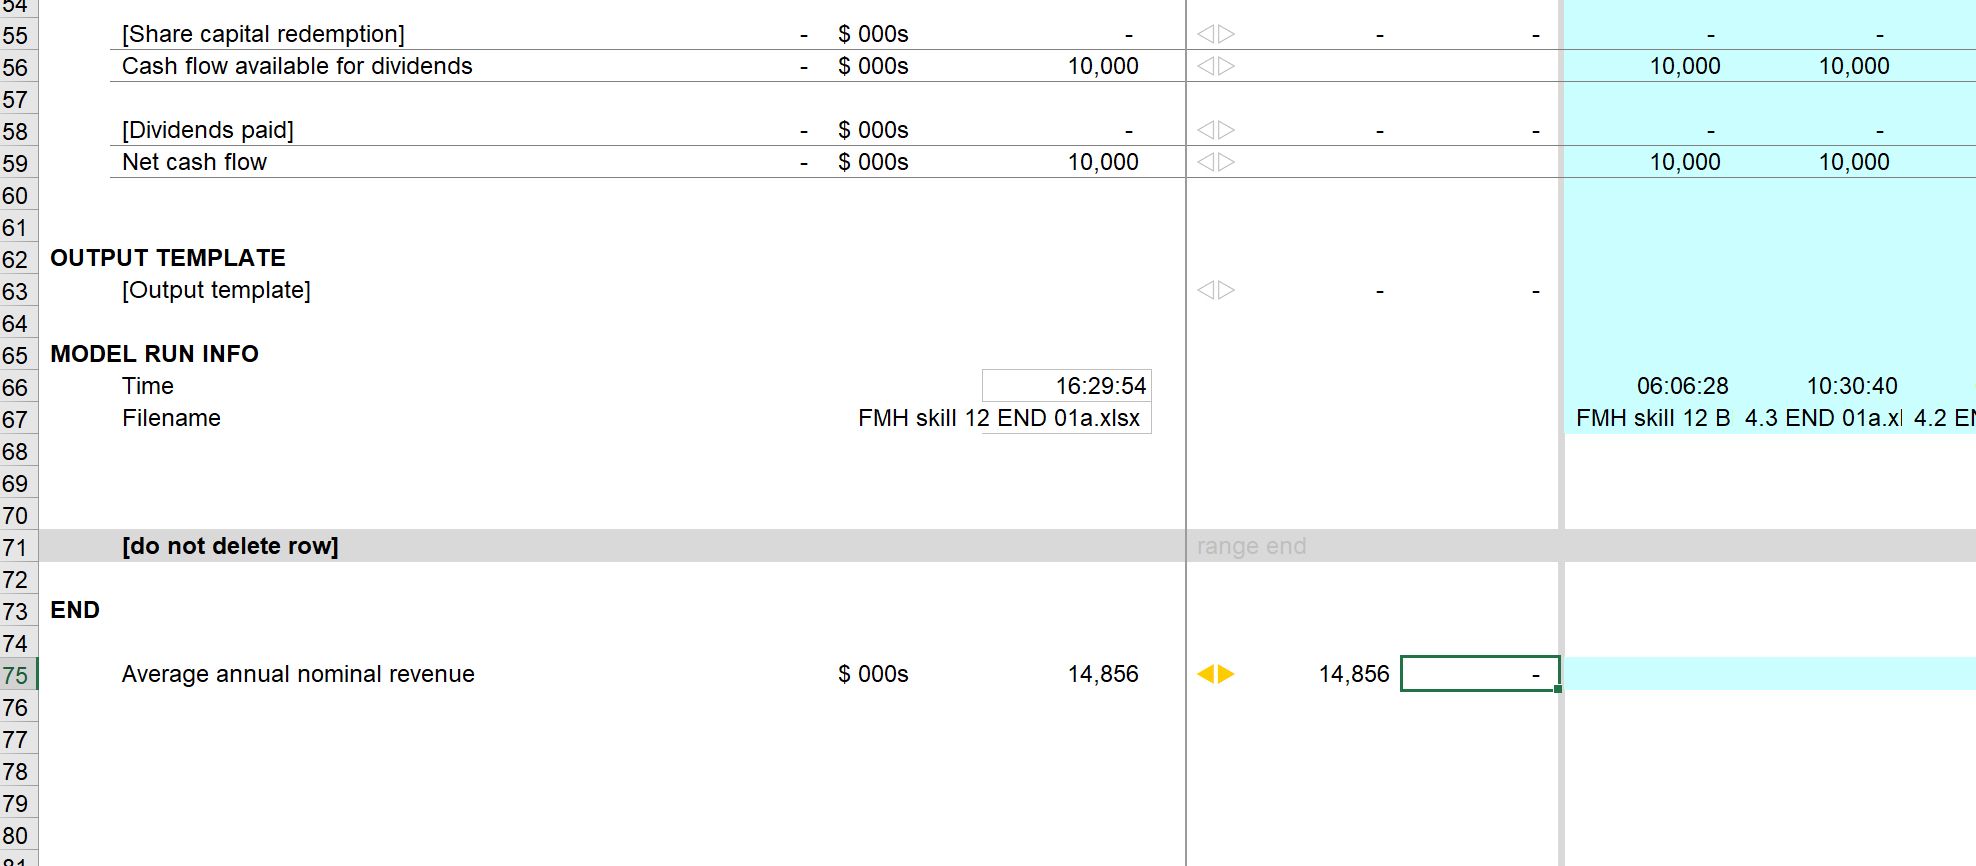
In our simple "early-stage" work in progress model, we have calculated "Average annual nominal revenue", a metric that this business wants to track.
To add this as a new tracked metric to our output sheet:
Step 1: Select the value.
In our case, this is calculated in Column F. It could also be a row total in Column H that we want to add to our output sheet.

Step 2: Run the "Add to output sheet" macro
The macro will create links on the output sheet. It will structure these links so that the values appear in Column H. Note that this is "out of normal column sequence" and breaks the standard link structure. This is a trade-off to allow the Output sheet to function. The new line item will appear at the bottom of the Output sheet.
Step 3: Reposition on the Output sheet
You will need to reposition the new line item to wherever you want it on the Output sheet. This is the same as we saw with Input relocation. Use Ctrl+x to cut the line item and relocate it.

Note that the macro will automatically format the source of the line item as an export.
Output sheet structure
In order to run this macro, you have to have a template line on the Output sheet. The template line must be named “OutputRowTemplate”.
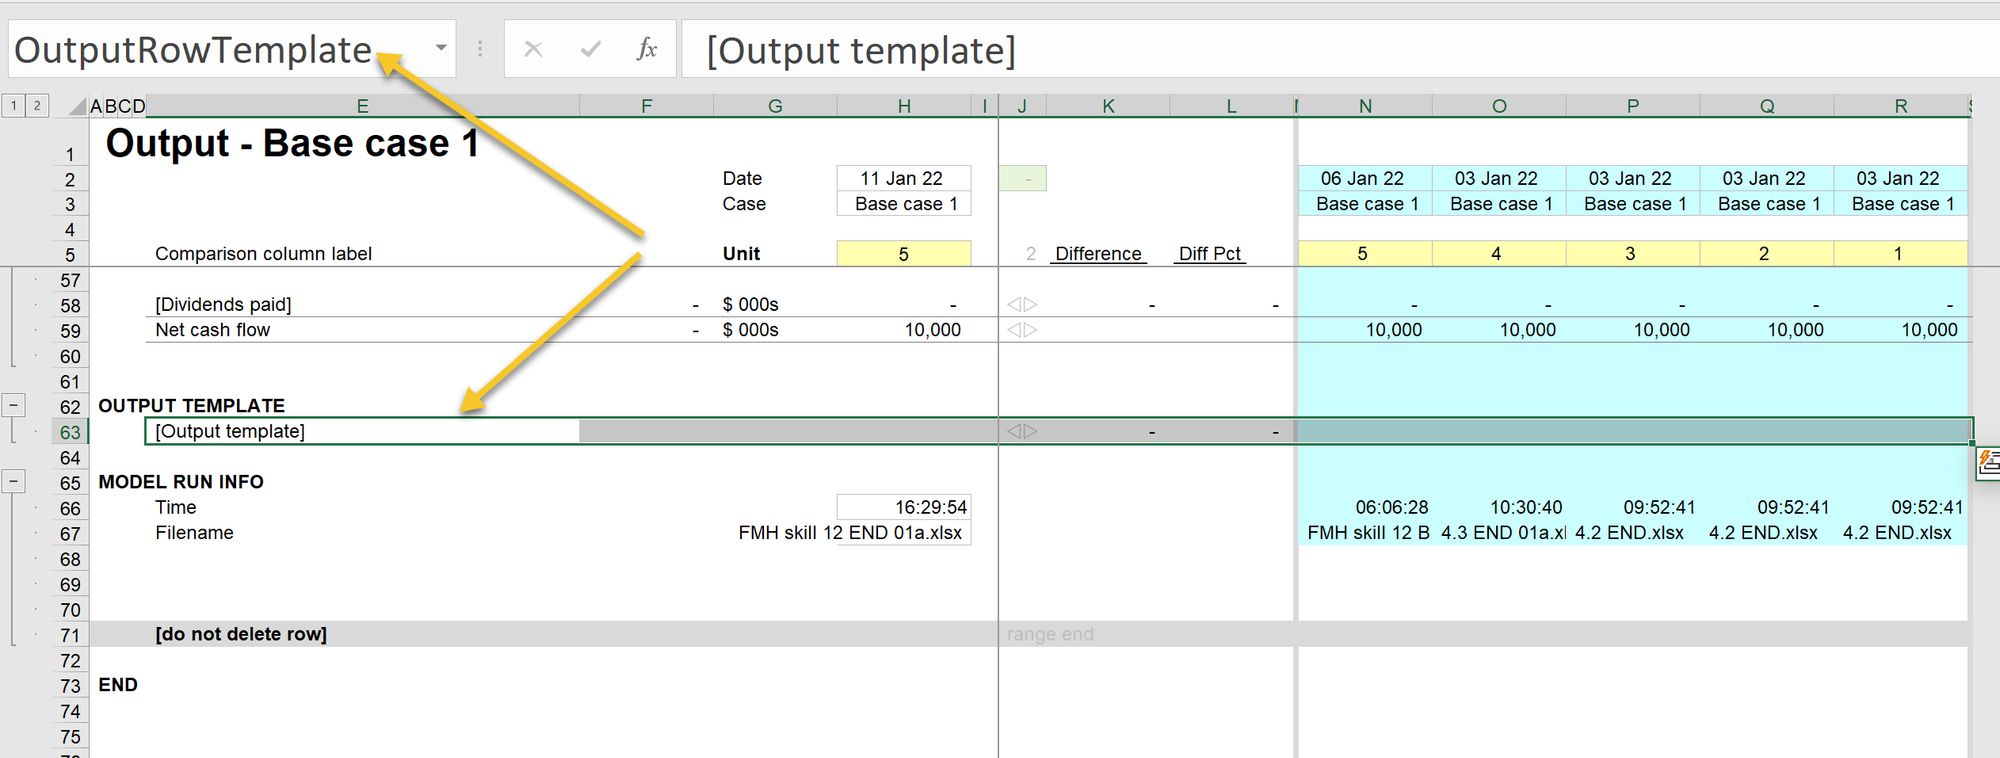
The files on this page have this setup, as does the Standard Start File. See the chapter on using a Start file.
Download the end of lesson model to review:
To obtain the worked example file to accompany this chapter buy the financial modelling handbook.

Comments
Sign in or become a Financial Modelling Handbook member to join the conversation.
Just enter your email below to get a log in link.