Modelling a refinancing - retesting our hypotheses
With our early share capital redemption structure in place, we can now test our hypothesis about refinancing.
The reference file for this bonus chapter is available in the file pack you'll receive when you purchase the handbook. See file 4.61 FMH early BEG 01a.
Running our 10 to 14-year scenarios gives us a progression of incoming investor IRR that looks like this, confirming our hypothesis:
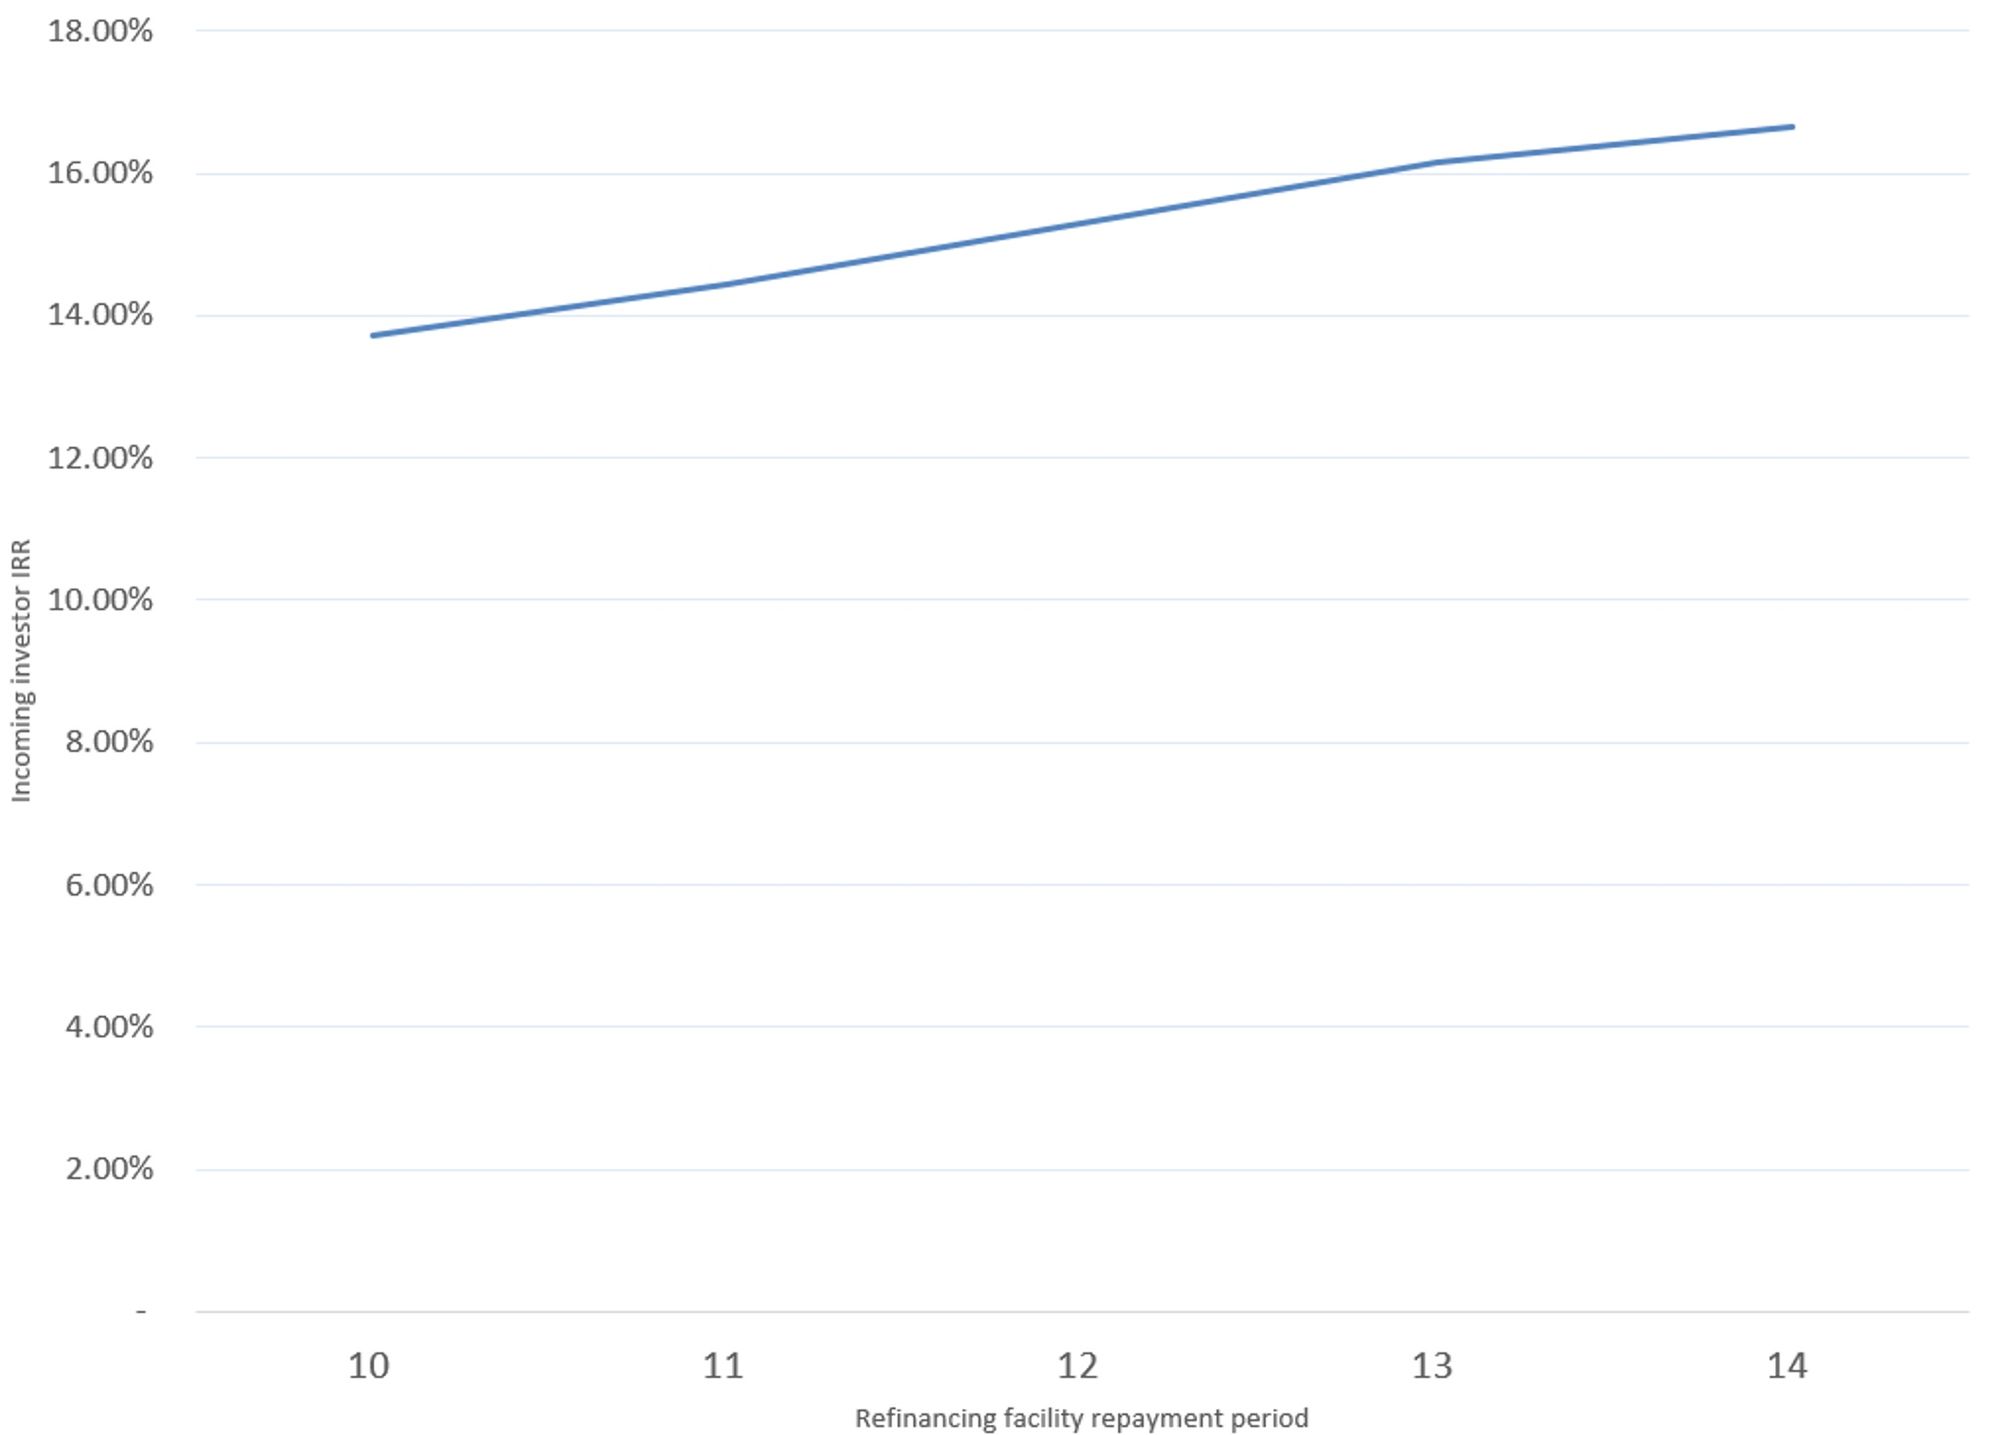
If you remember back to when we first talked about our “F11 quick chart” - we should always be looking at any discontinuities we see in our charts. In this chart, we can see that the slope of the IRR progression changes when we move from 13 to 14 years. What’s going on here?
If we check the cash flow statement, we can see that with a 14-year refinancing, we hit the limit of the cash we can extract through early share capital redemption.
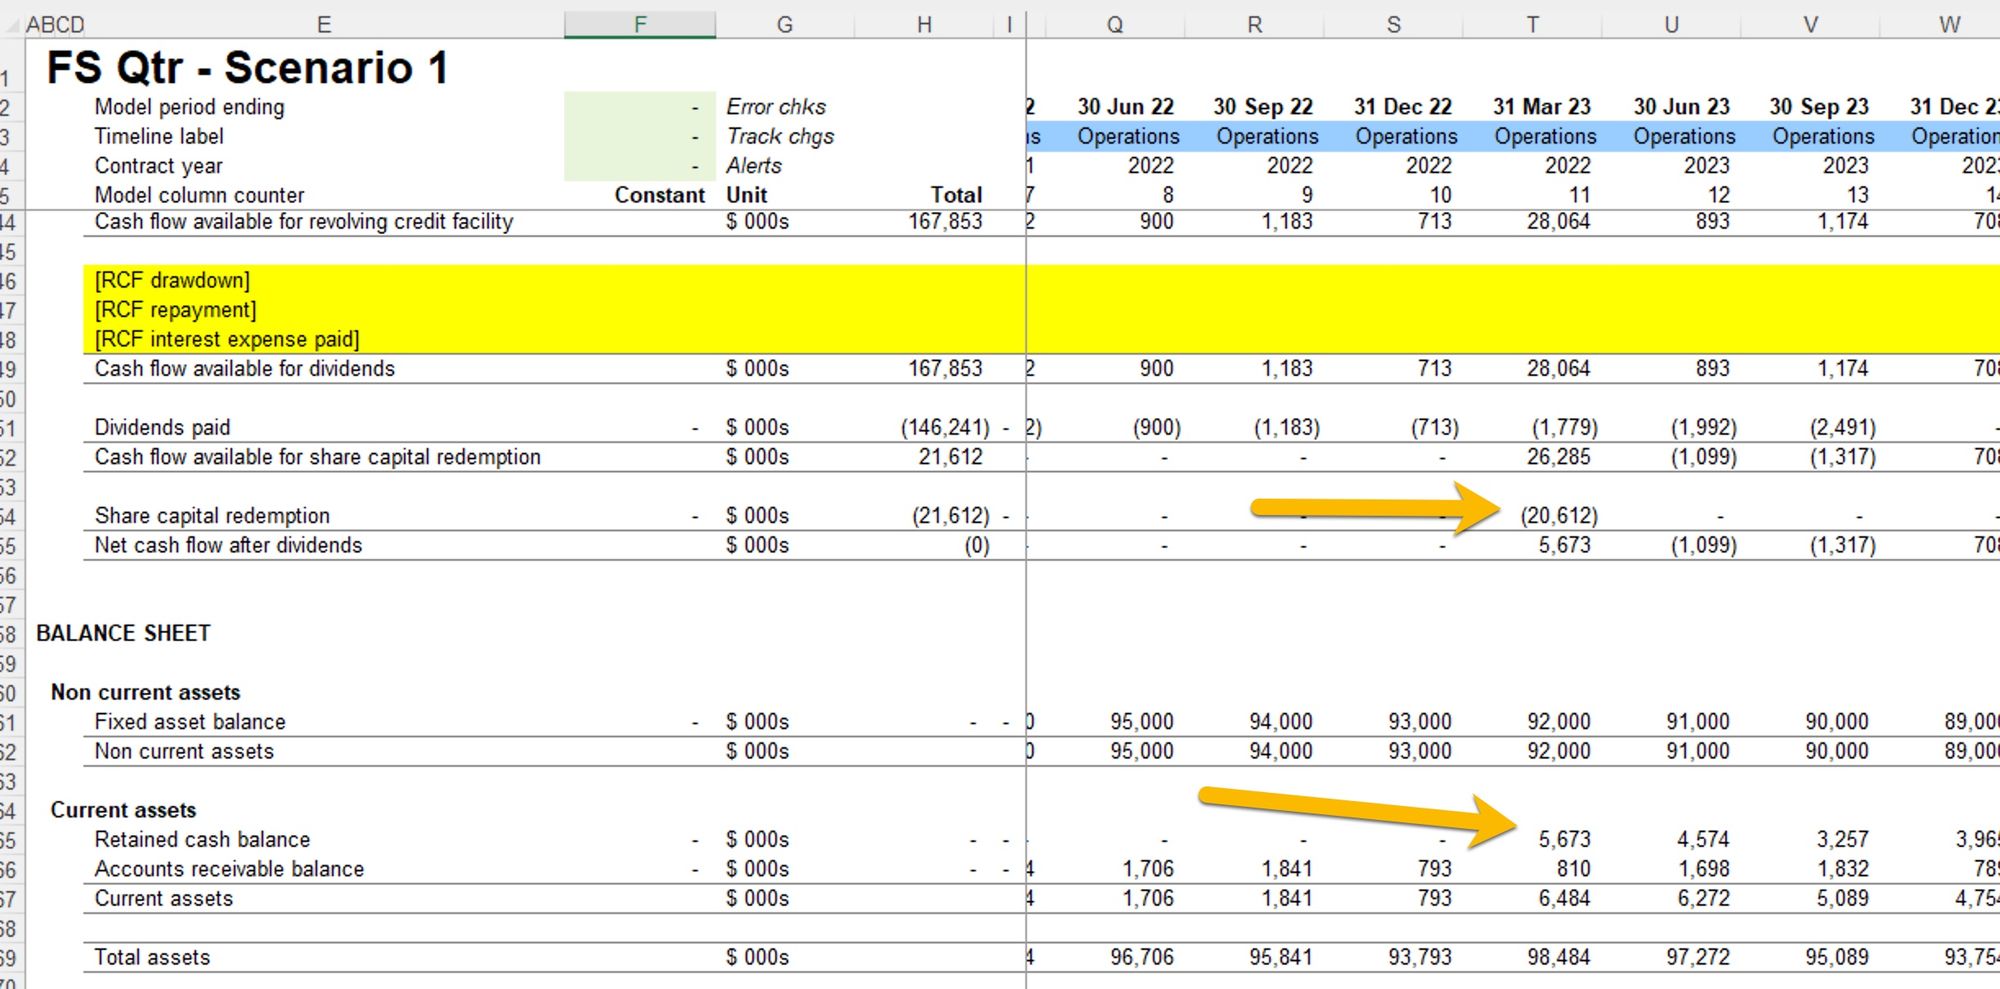
We can see that the refinancing creates a $28m surplus. However, we are only able to distribute $22.4m through dividends and early share capital redemption. We are therefore retaining $5.7m of cash on the balance sheet, reducing the IRR gain from the refi.
Throughout this section, we have seen how our model can be used for exploratory analysis.
Your task is now to test for yourself how the debt sizing DSCR and interest margin impact shareholder IRR.
The solution for this bonus chapter is available in the file pack you'll receive when you purchase the handbook. See file 4.61 FMH early END 01a.

Comments
Sign in or become a Financial Modelling Handbook member to join the conversation.
Just enter your email below to get a log in link.