Modelling depreciation - solution
My hypothesis about how depreciation will impact IRR
Download the solution case for this lesson:
To obtain the worked example file to accompany this chapter buy the financial modelling handbook.
We have already seen that differences between the income statement and the cash flow statement can impact the dividend profile.
We are now going to add $100m of charge to the income statement.
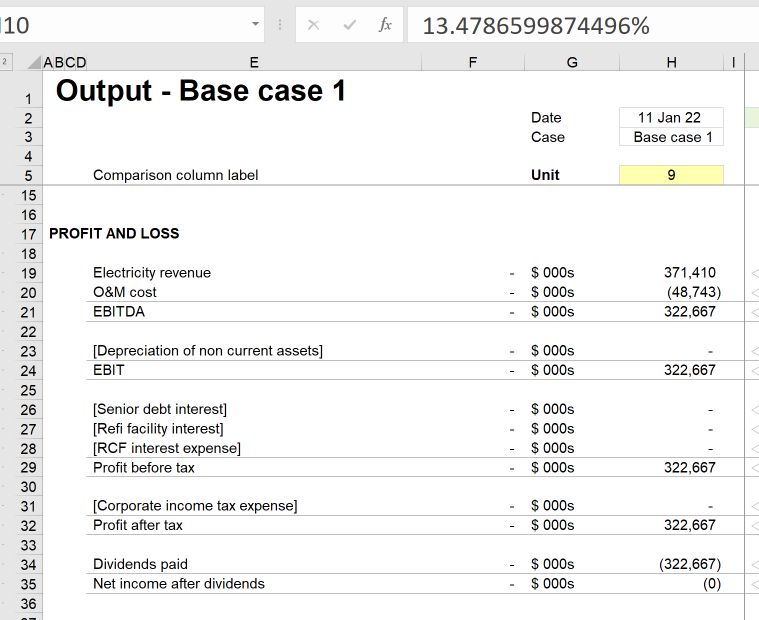
Currently, the total Profit after tax is $322.7m. Once we add depreciation to our income statement, we will reduce Profit after tax by $100m to $222.7m.
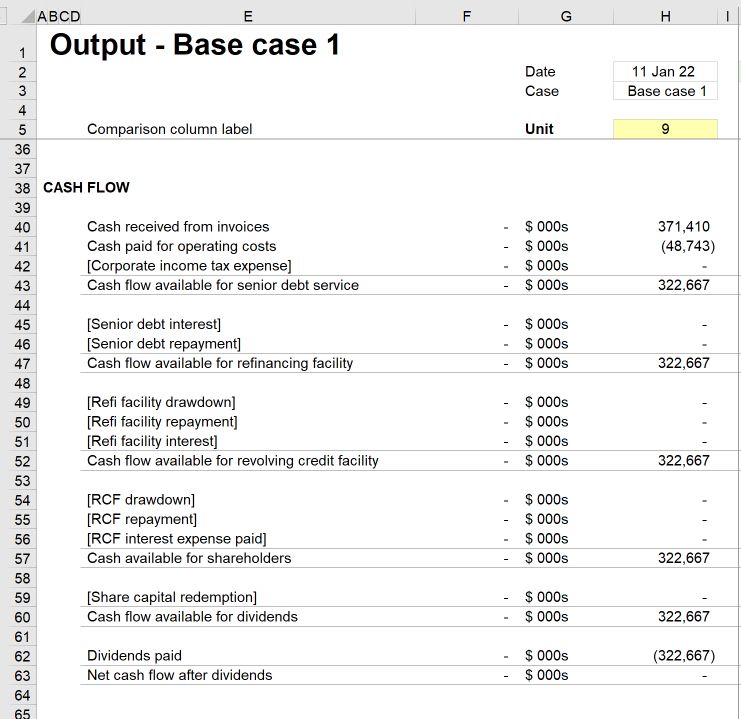
There will be no change to the cash flow statement. Our Cashflow available for dividends will still be $322.7m.
We have set up our model to pay the lower of earnings available and cash available for dividends. Therefore over the 25 years of the project, the total dividend will have to be the lower of those two numbers - $222.7m.
Therefore, there will be $100m of cash "trapped" in the business.
I expect that, with the business paying out $100m less dividend, IRR will go down by a significant amount.
How much do I expect IRR to reduce?
Well, we are going to reduce dividends by $100m. This is around 1/3rd of the current dividend.
While I know that IRR is not a linear function, I would broadly expect IRR to reduce by around 1/3rd. I expect IRR to land somewhere around 9%. This is a very rough guess but gives me a general expectation.
If IRR only reduces by 1% or goes to zero, I'll be surprised and:
- a. checking my workings to see if I have made an error and then
- b. checking my thinking to make sure I understand what's going on.
Modelling depreciation
Step 1: Create a new flag
Use Skill 7: How to copy a calculation block to copy to set up a "Useful life of asset flag".
There are two blocks needed here:
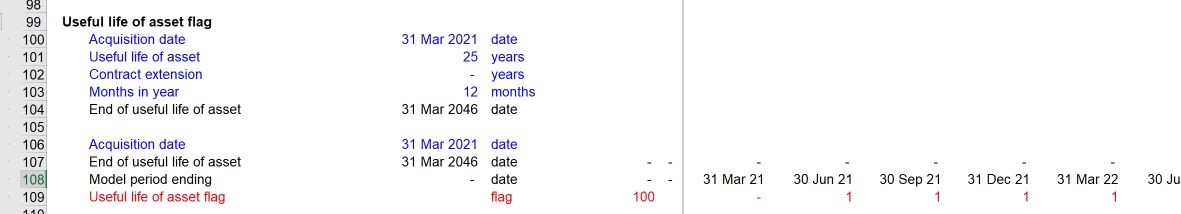
- Calculation of the End of useful life of asset date. For this, I'm copying the block from the Last operating period flag. I'm swapping out "Operating years remaining" and replacing it with "Useful life of asset" (a link to a new input on the input sheet). At present, these values are the same, but they might not always be.
- Calculation of the Useful life of asset flag. For this, I'm copying the Operating period flag and replacing the "End of operating period" date with the "End of useful life of asset" date. These steps are simply creating links to replace links in the block. This should be familiar territory for you now.
Link your newly created flag to the Fixed Asset sheet.
Step 2: Calculate depreciation
In addition to the Useful life of asset flag, we need:
- The $100m fixed asset initial balance. I copied the link from the top of the fixed asset corkscrew using Skill 4
- The 25-year useful life of asset value. Again, I used Skill 4 and copied a link from the flag calculation block.
- The number of periods in a year. I created a link using skill 2
Once we have the ingredients, the calculation is straightforward.
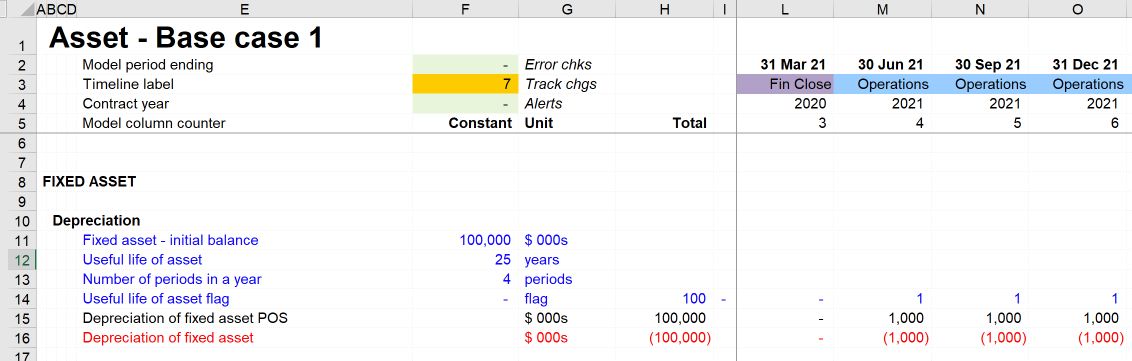
Remember to add POS to the label and then copy a sign switcher, as depreciation will be added to our income statement.
Step 3: Link depreciation into our model.
Depreciation will impact both the asset and liability side of our balance sheet.
- The asset side of the balance sheet: link depreciation into our fixed asset balance. This will reduce the fixed asset balance, which appears on the asset side of our balance sheet.
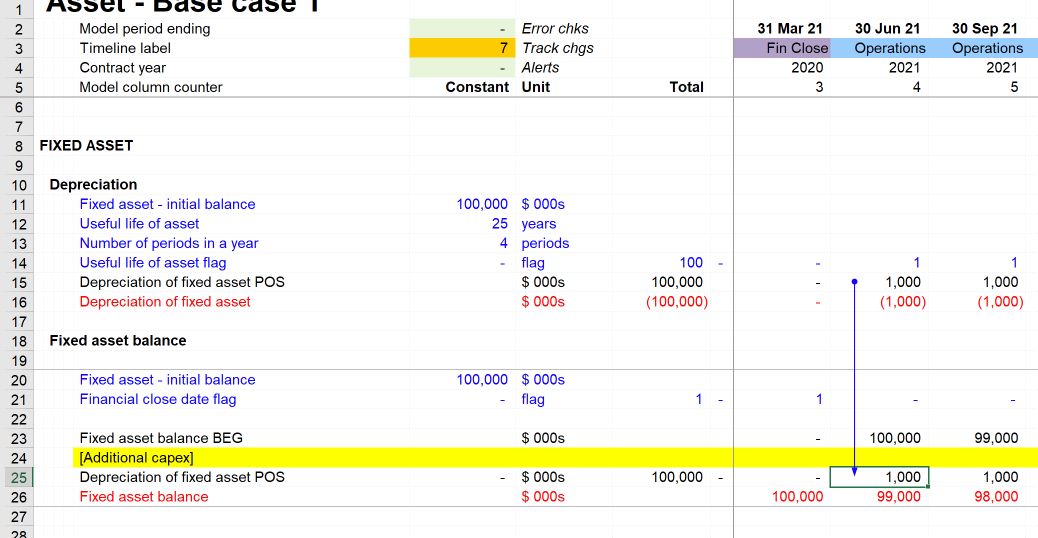
- The liability side of the balance sheet: link depreciation to the income statement. This will flow through to retained earnings and reduce the liability side of our balance sheet.
Our balance sheet should continue to balance since we changed both the asset side and liability side by the same amount.
Step 4: Yip, you guessed it.
Run the Section Completion Checklist.
How has depreciation impacted IRR?
Were we right?
If we look at IRR, we can see that it has gone down to 8.47%. This is within the range of what we expected.
Looking at our output sheet, we can see that total Profit after tax has been reduced by $100m. And that dividends paid are now $222.7m.
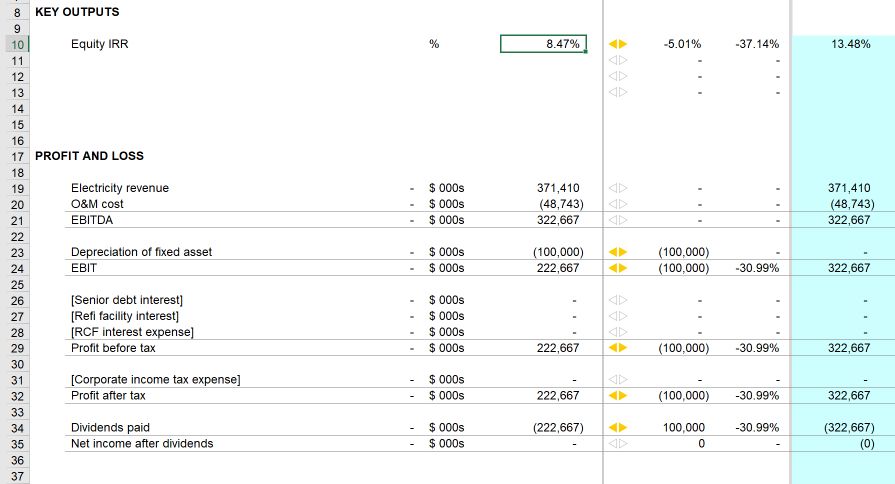
What about cash. We expected $100m of cash trapped in the business due to the profit restriction.
If we chart retained cash, we can see that it now has this profile:
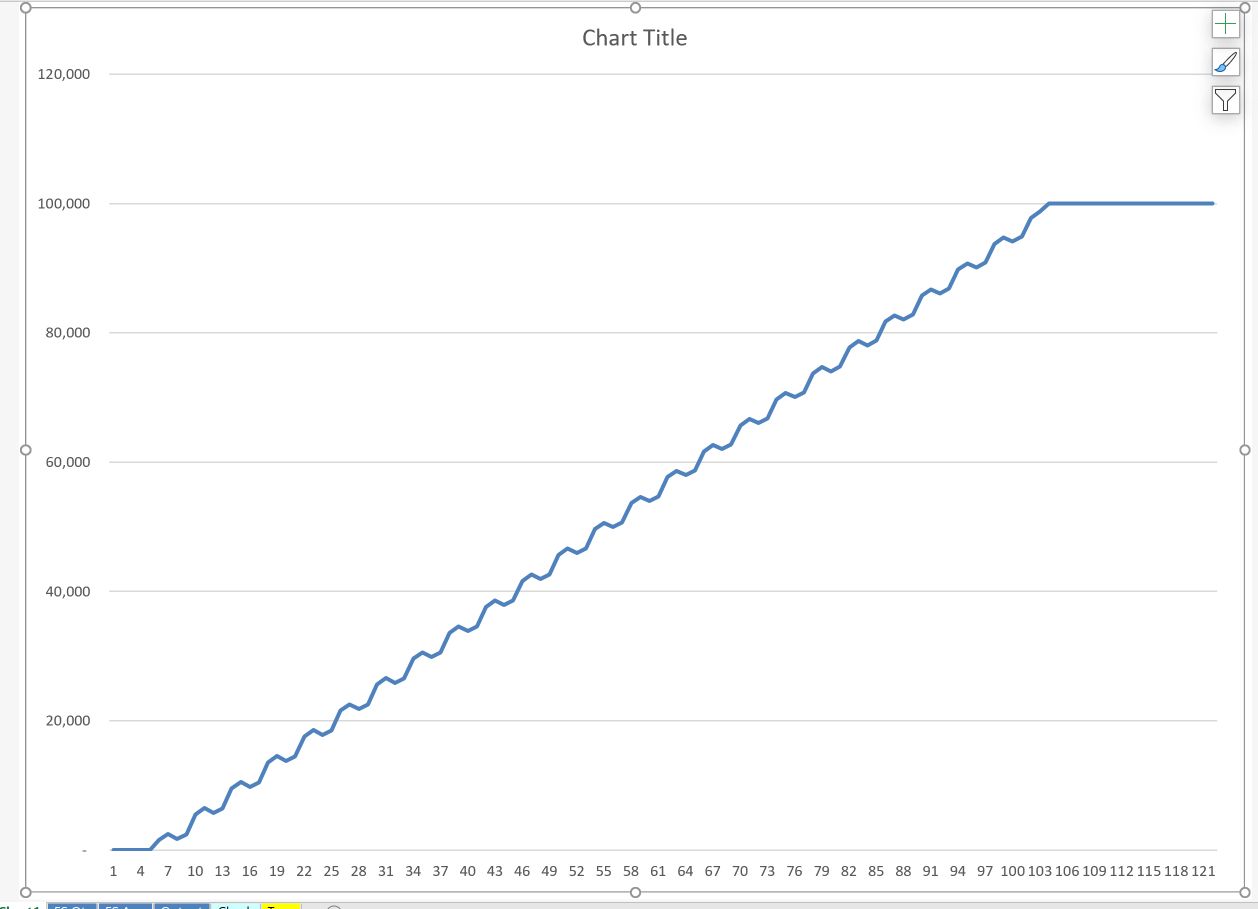
We can still the seasonality impact while at the same time we are building up a cash balance that reaches $100m by the end of the 25 years.
How will we get this money out of the business?
If you remember, when we introduced the $100m fixed asset balance, we also introduced $100m of share capital to pay for it. We have expensed the full amount of the $100m by depreciating it over 25 years.
We have not repaid the $100m to shareholders. In a project like this, it would be typical for shareholders to be repaid at the end of the concession.
That's what we're going to action next - the repayment, or "redemption" of the $100m share capital.

Comments
Sign in or become a Financial Modelling Handbook member to join the conversation.
Just enter your email below to get a log in link.