Modelling dividends - solution
What is the maximum amount of dividend that the model could pay?
Looking at the income statement, at present, there is $322.7m of Profit after tax being generated over the life of the project.
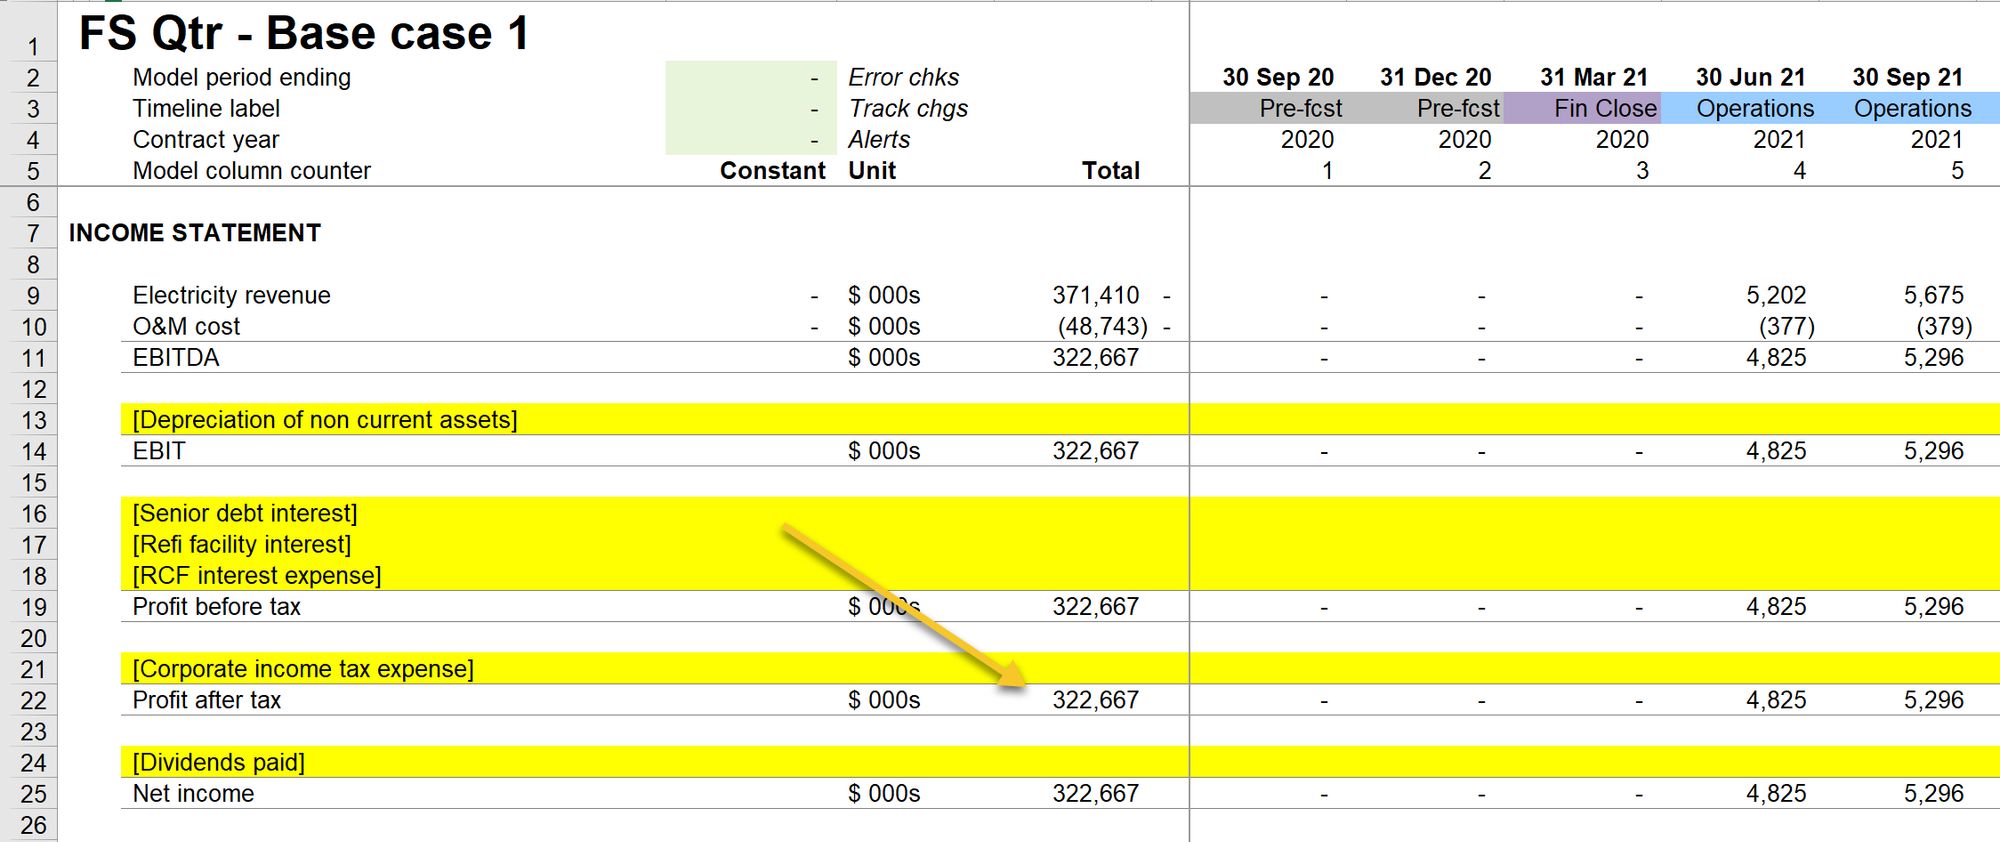
At present, those profits are not going anywhere. They are being retained in the business. If we look at the chart of Retained earnings, we can see that undistributed earnings are building up to the same amount - $322.7m.
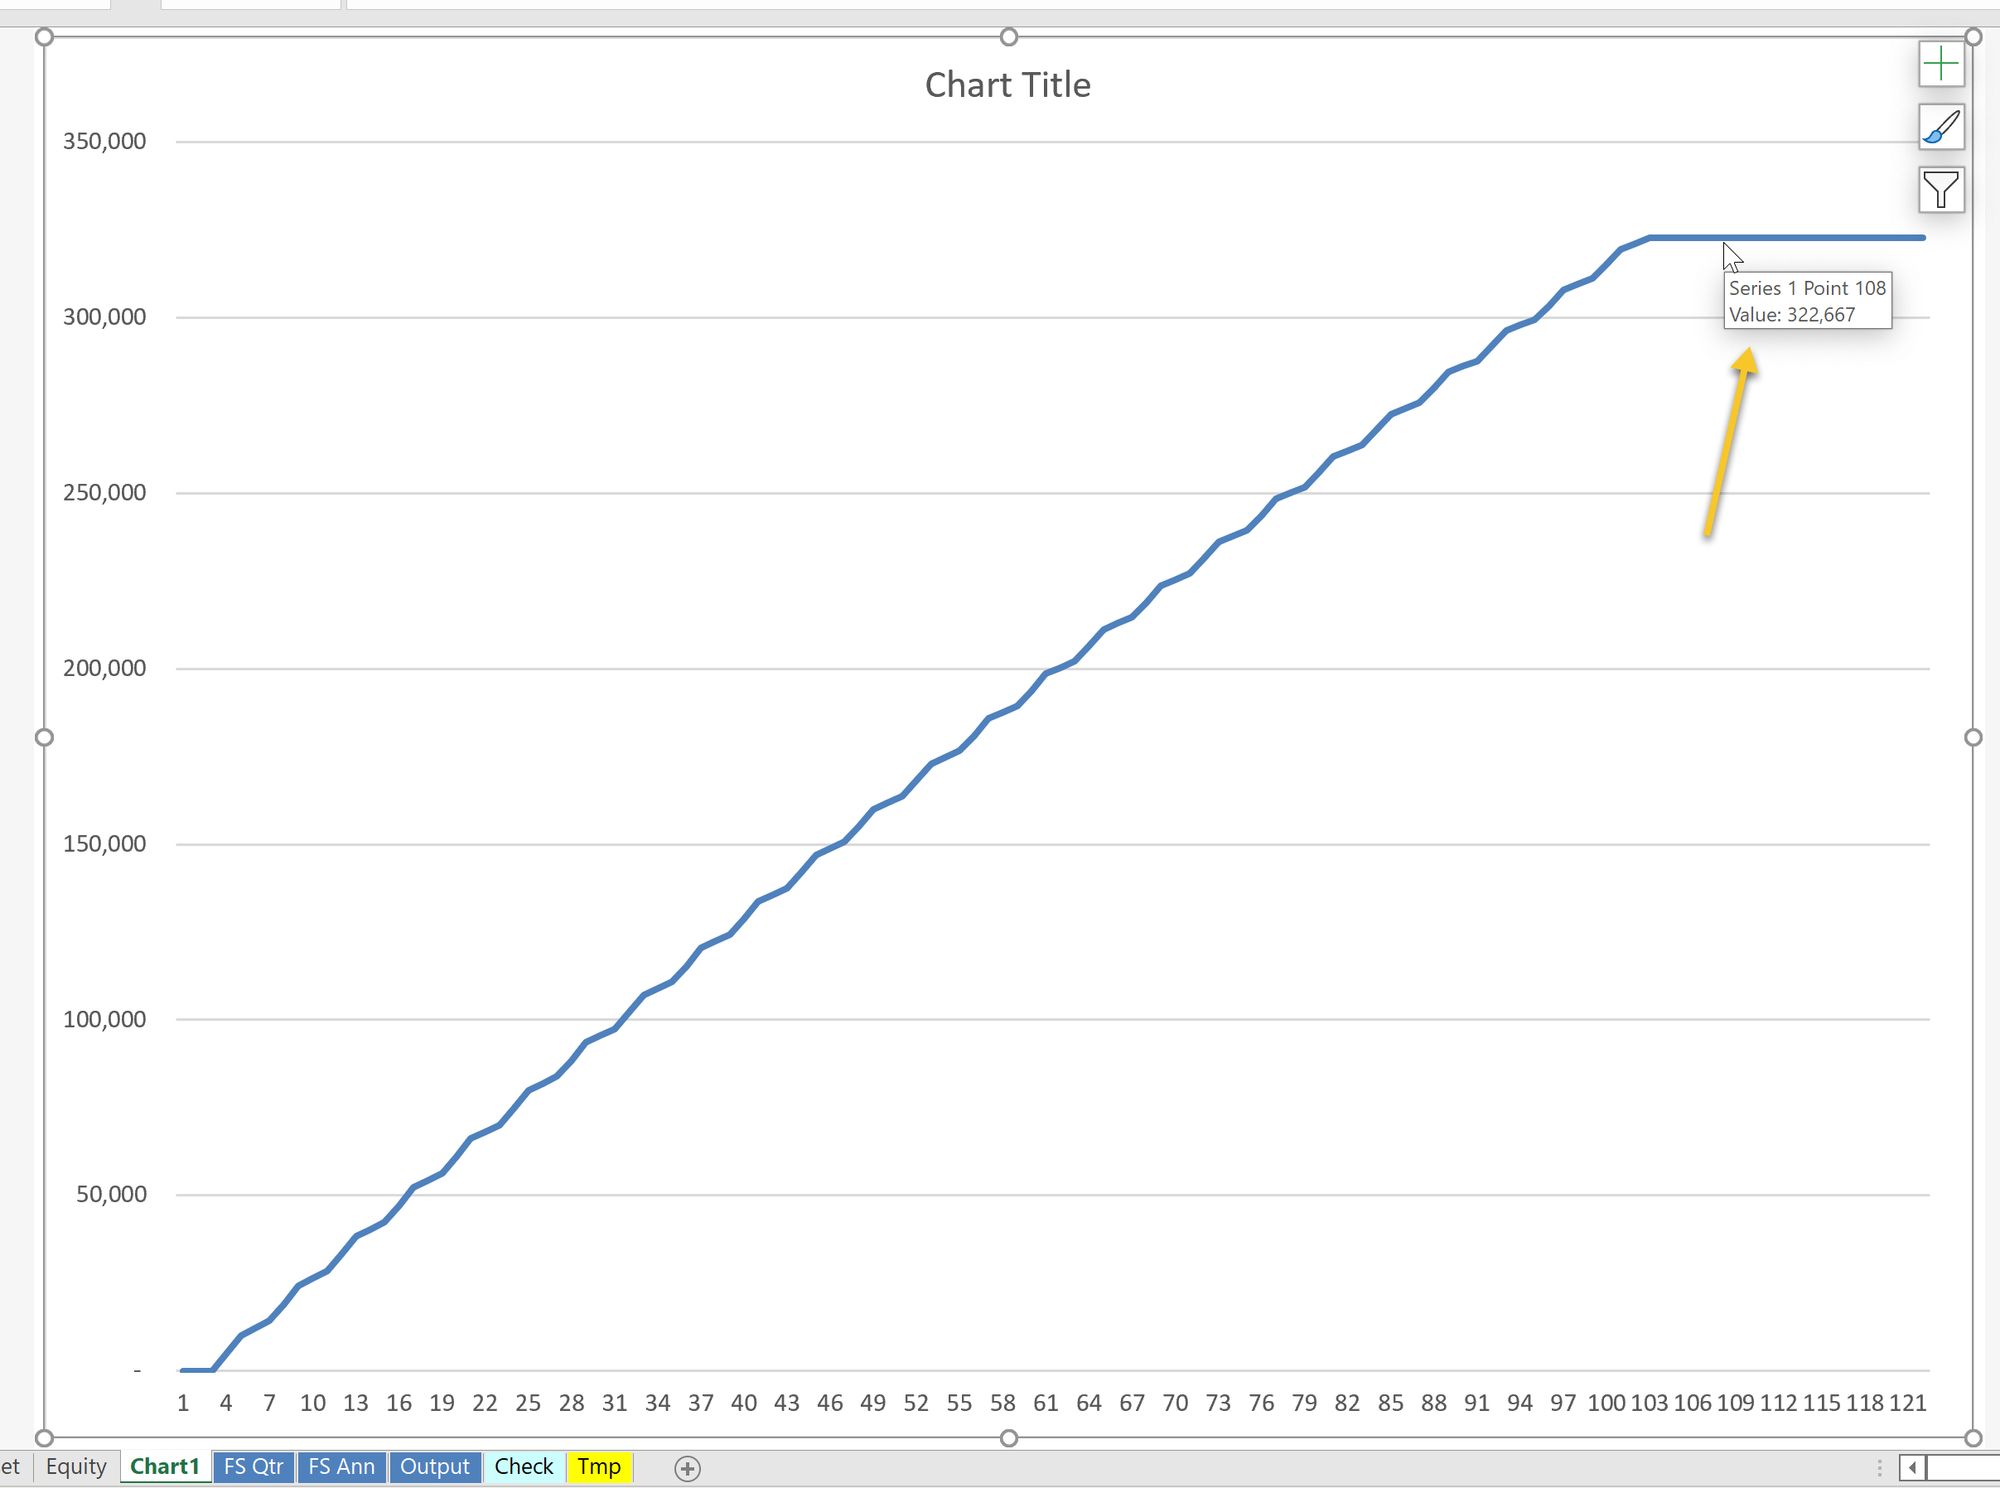
Once we model dividends, all of this will be distributed. Therefore the total amount of the dividend will be $322.7m
Let's walk through the calculation.
We will work on the Equity tab.
Step 1: Add section headings.
I like to signpost where I'm headed. If I know ahead of time, I'll add the section and sub-section headings that I need. I don't always know ahead of time!
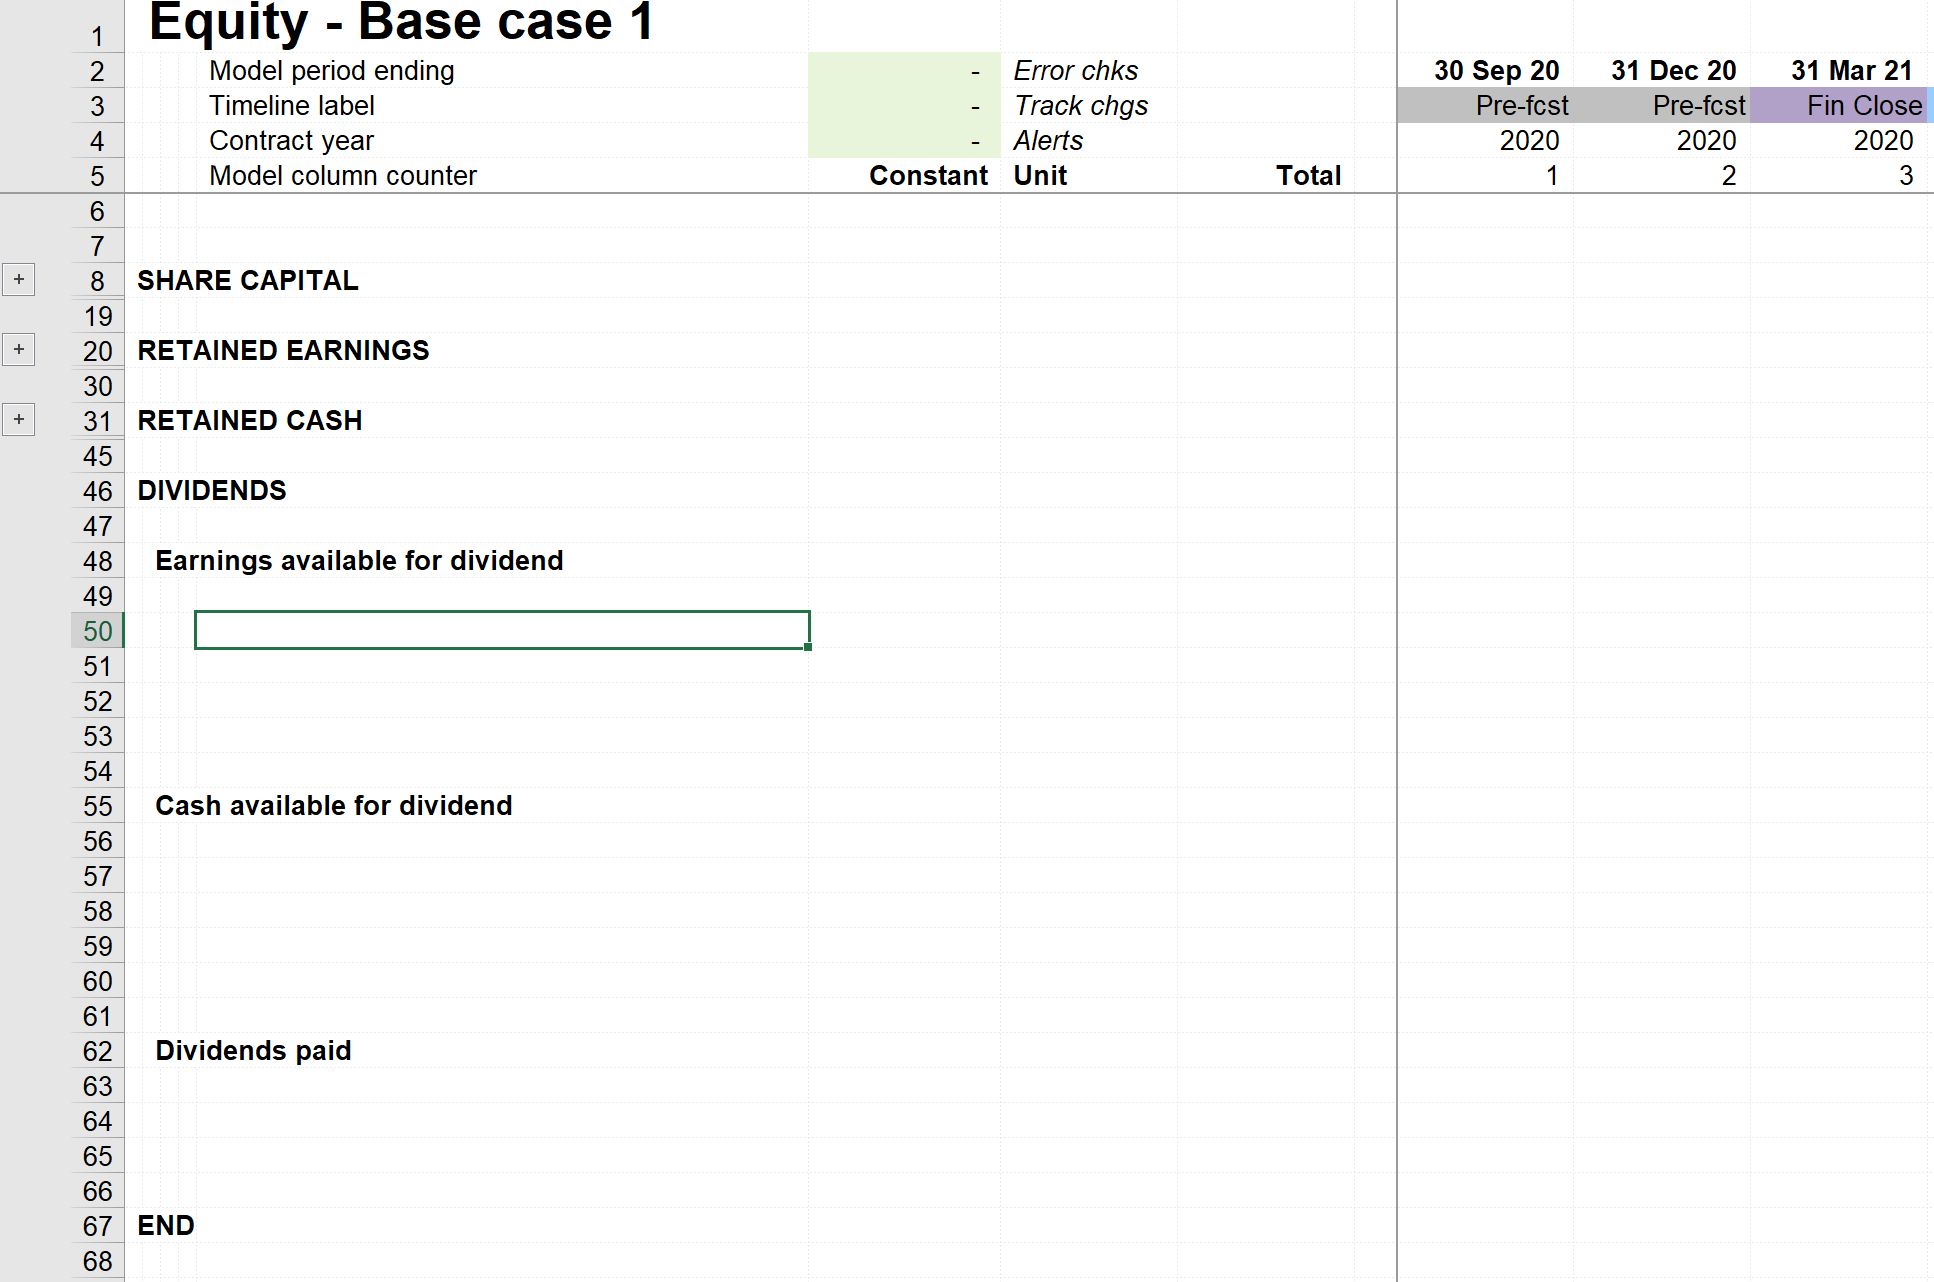
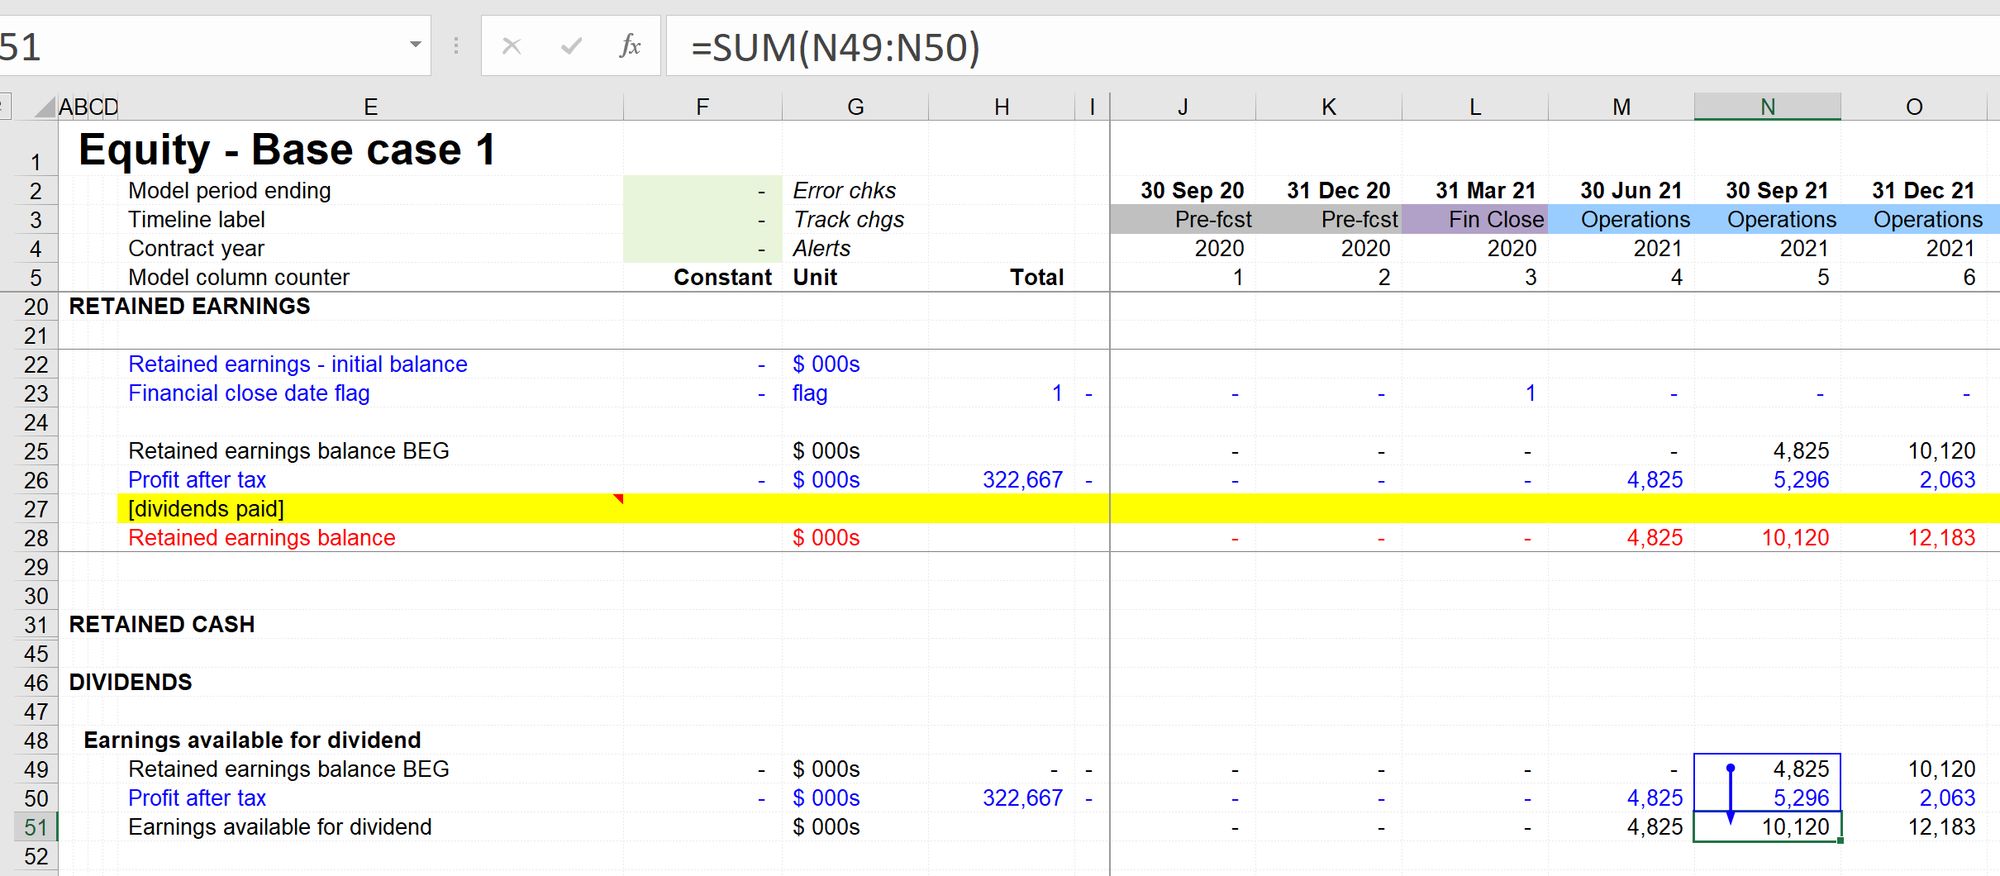
Step 2: Earnings available for dividend
We know that the earnings available will be the sum of the earnings at the beginning of the period and the Profit After Tax for the period.
Therefore we'll link to the beginning balance of Retained earnings using Skill 2.
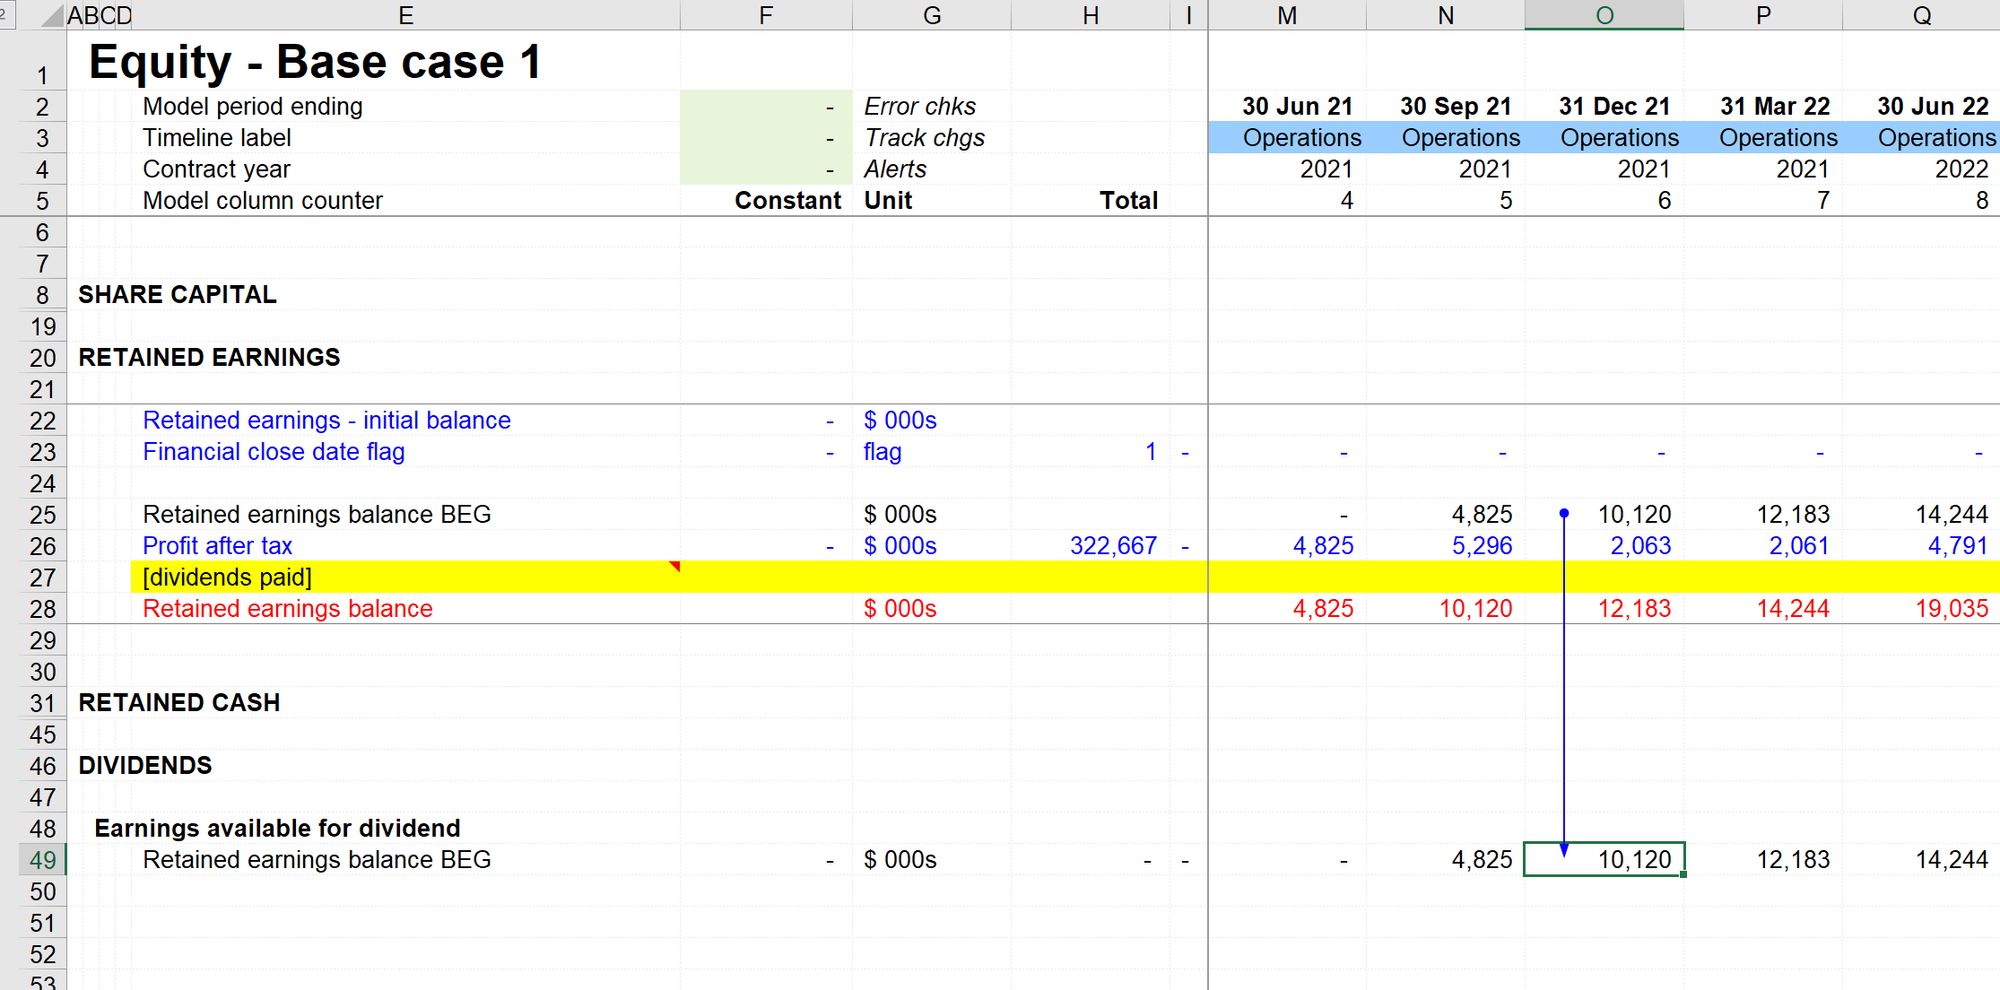
We'll then copy the existing link to Profit After Tax that's already in the Retained earnings corkscrew, using Skill 4
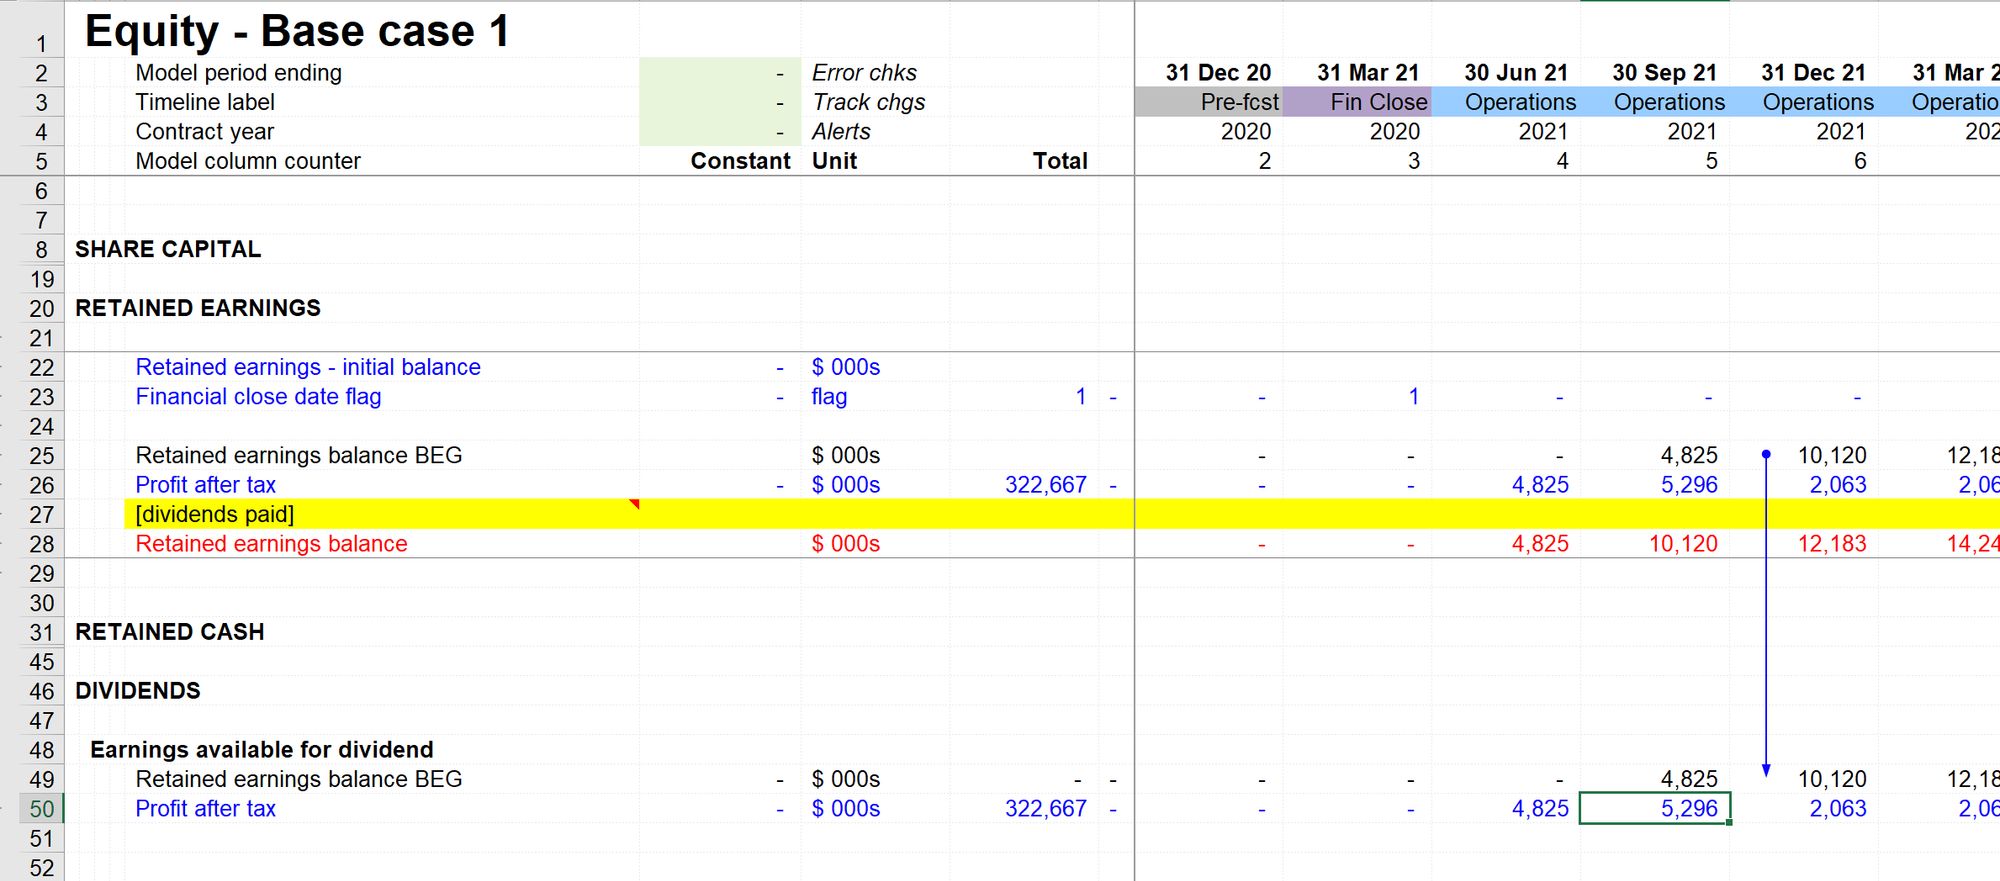
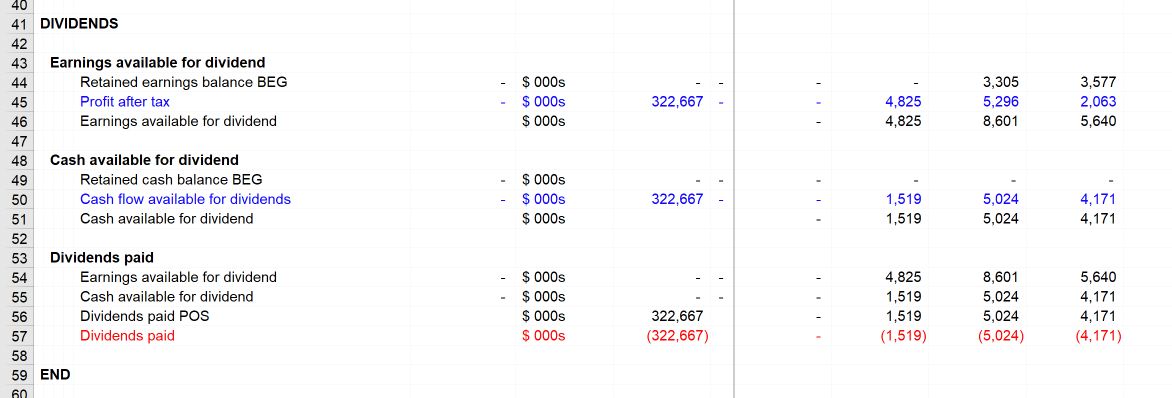
Set up the calculation for Earnings available for dividend.
Note that this amount is a balance. Conceptually, it’s the balance of earnings available at the end of the period, immediately prior to making a distribution. Because it’s a balance we don’t need to add a row total.
Step 3: Repeat the same steps for cash.
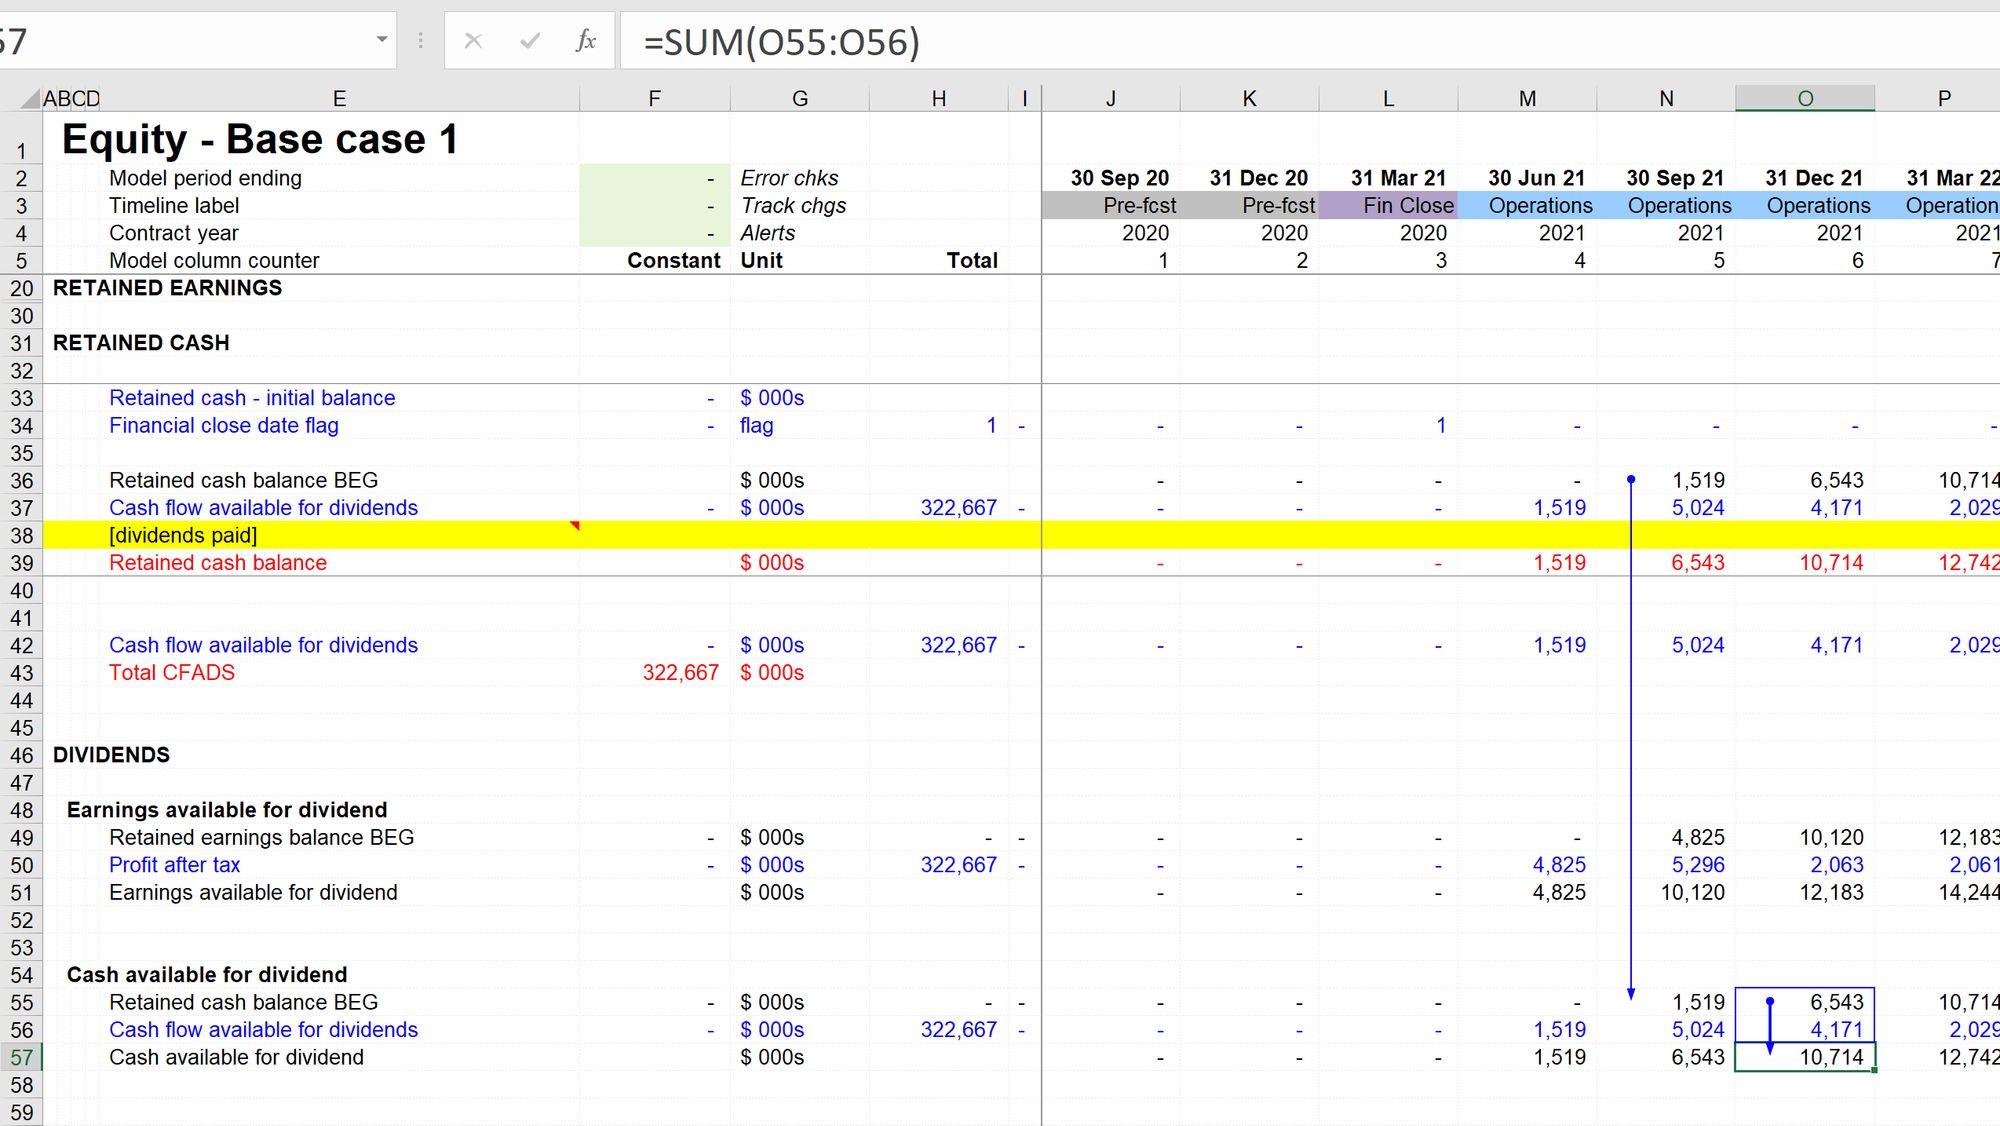
Step 4: Calculate the minimum of earnings available and cash available.
We now need a new calculation block bringing in Earnings available and Cash available as new ingredients.
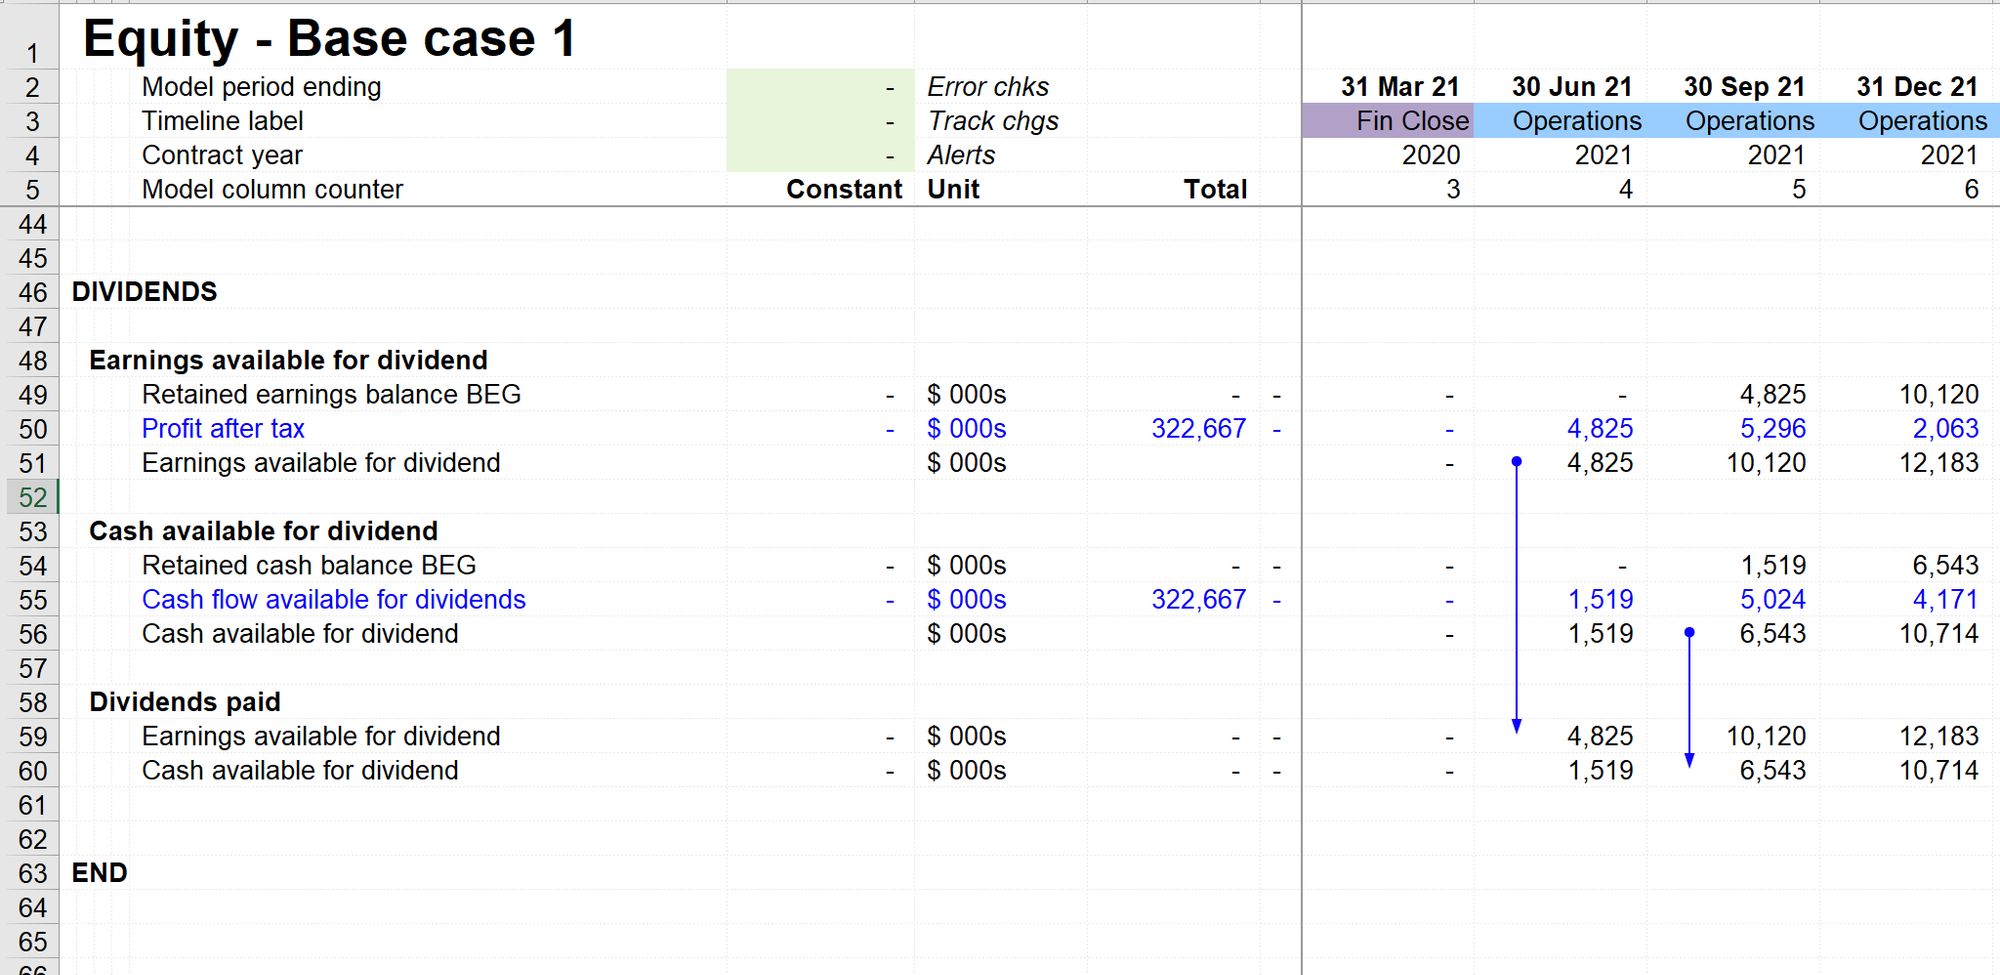
The calculation we are writing needs to do two things:
- Calculate the minimum of retained cash and retained earnings
- Prevent the amount of distribution from being a negative number.
The MIN and MAX functions will be useful here.
(How long have we been working together - and I'm only now introducing new functions. Like I said at the start, this isn't a book about Excel functions).
Our formula will therefore be :
The formula will first calculate the lower of retained cash and retained earnings, and then take the maximum of that answer and 0. Therefore if the value is negative, the formula will always return 0.
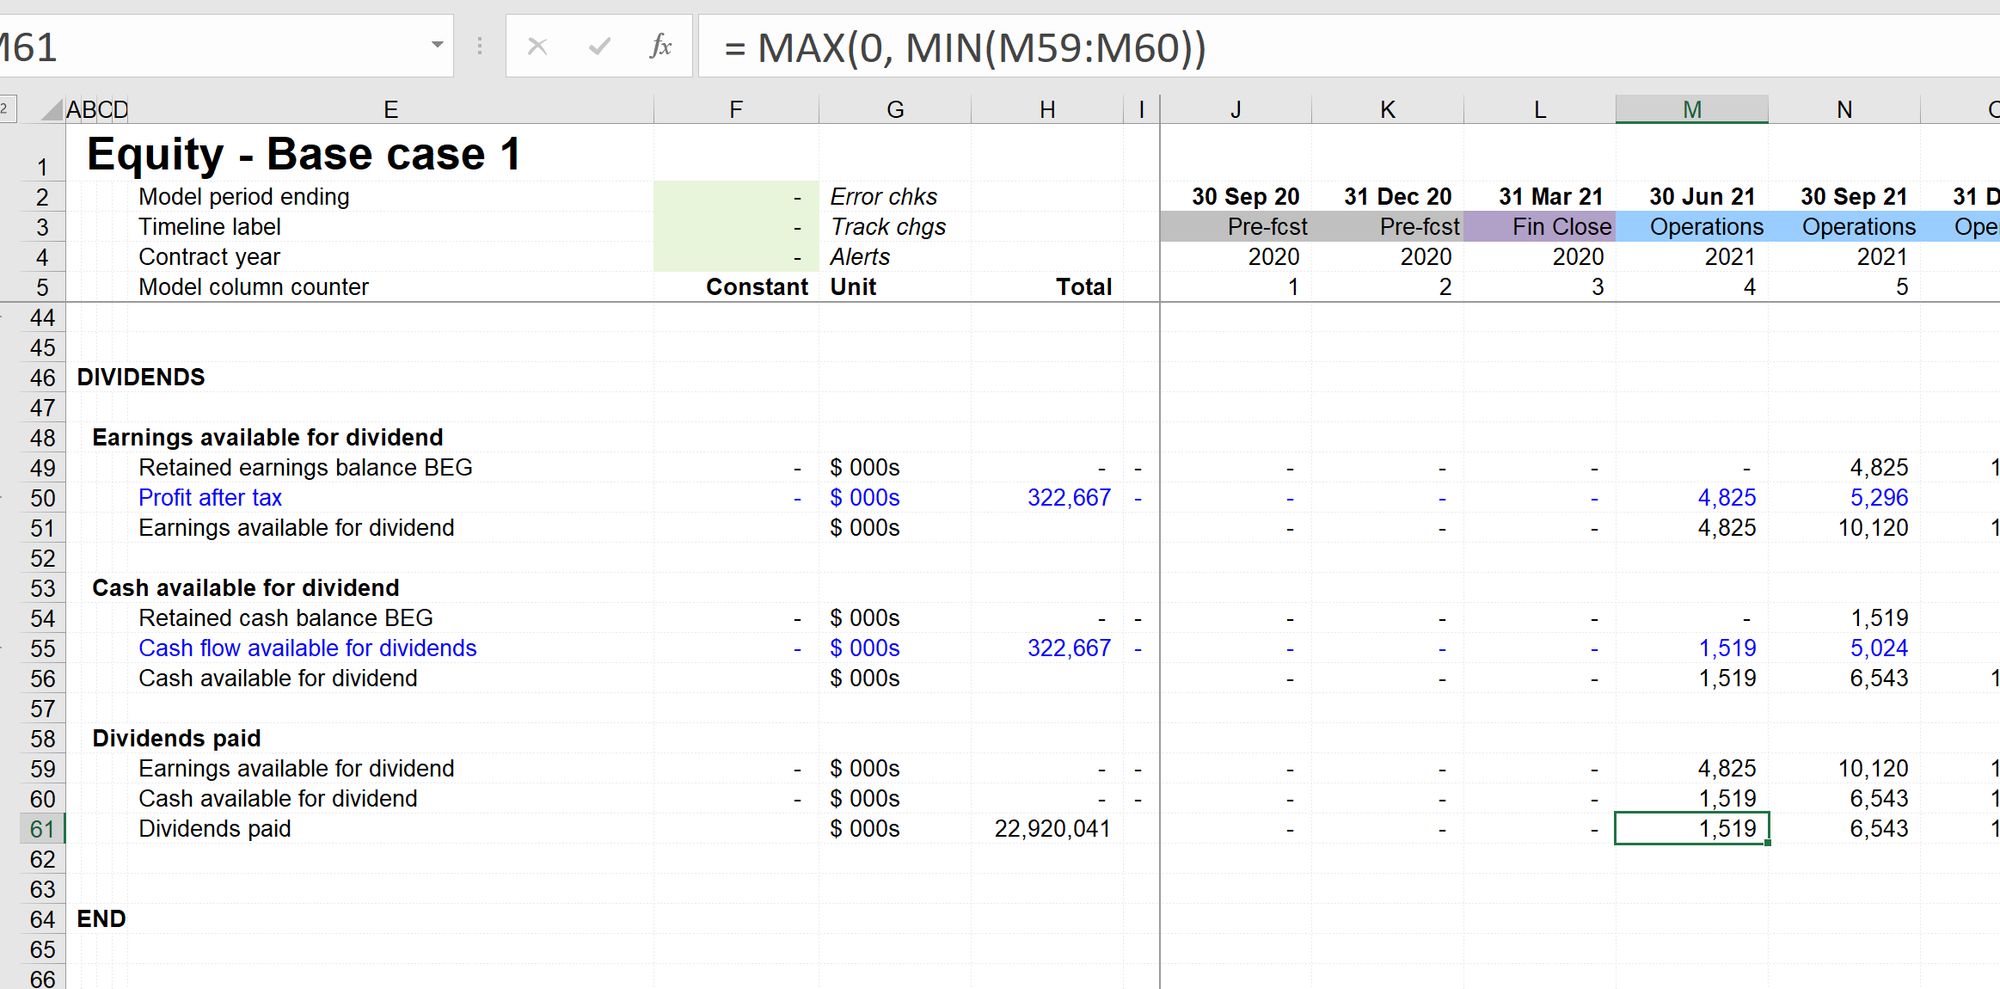
Hopefully, a question should be jumping off the page at you:
Why is our calculation returning $22.9bn of dividends?
It's all down to the last step in the process.
Step 5: Add the dividend paid line into the retained earnings and retained cash corkscrews.
Once the dividends have been paid, the earnings and the cash have been distributed and are no longer available to distribute again; we have to reduce each balance by the amount of the dividend.
Use Skill 2 to create a link to our new Dividends paid calculation in the retained cash corkscrew. Then use skill 4 to copy the link into the other corkscrew.
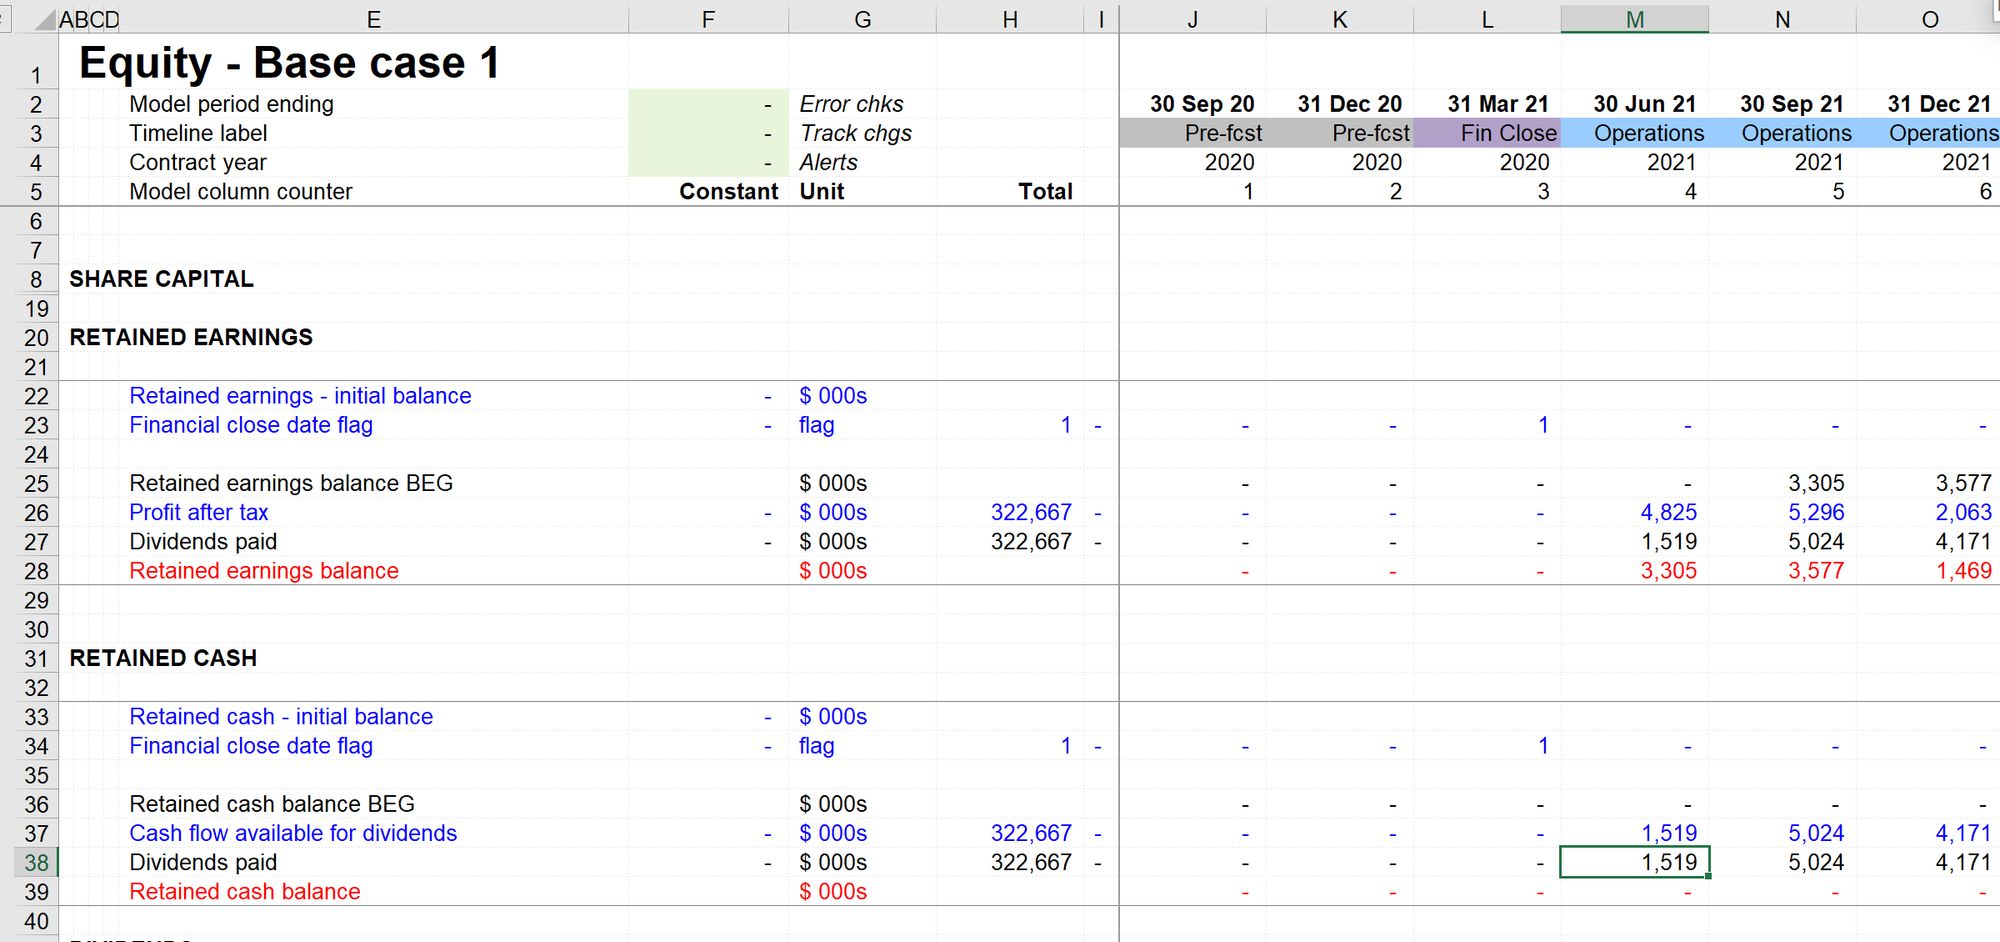
Now we can see that the amount of dividend paid conforms to our hypothesis.
Step 6: Add dividends to the income and cash flow statements
We have placeholders on the income statement and cash flow statement for the dividend line. Note that you’ll need to sign switch the dividend paid line before adding to the financial statements.
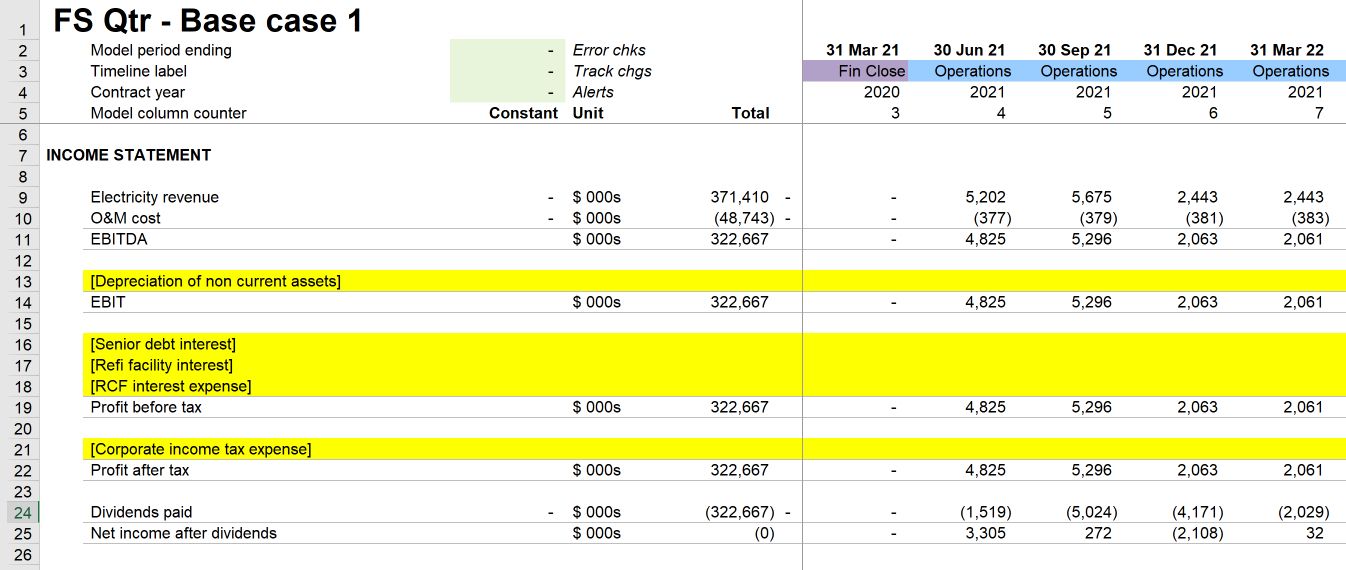
In the solution file, I changed the label on the income statement to read “Net income after dividends” as I think this is clearer. I made a similar change on the cash flow statement.
Download the model completed to this point:
To obtain the worked example file to accompany this chapter buy the financial modelling handbook.
Before we move to depreciation, a slightly tricky analytical question:
All the available cash being paid out, leaving a cash balance of zero in each period? However, not all the earnings are being paid out, leaving some retained earnings in the business in each period? Why is that?
The answer is at the beginning of the next section. Try to develop a hypothesis for yourself before moving on.

Comments
Sign in or become a Financial Modelling Handbook member to join the conversation.
Just enter your email below to get a log in link.