How debt repayment profiles affect IRR
We have now seen that both the amount of debt and the cost of debt will impact the equity IRR. The repayment profile of the debt will also have an impact.
We have already modelled level principal repayment. We are going to look at two other possible repayment profiles.
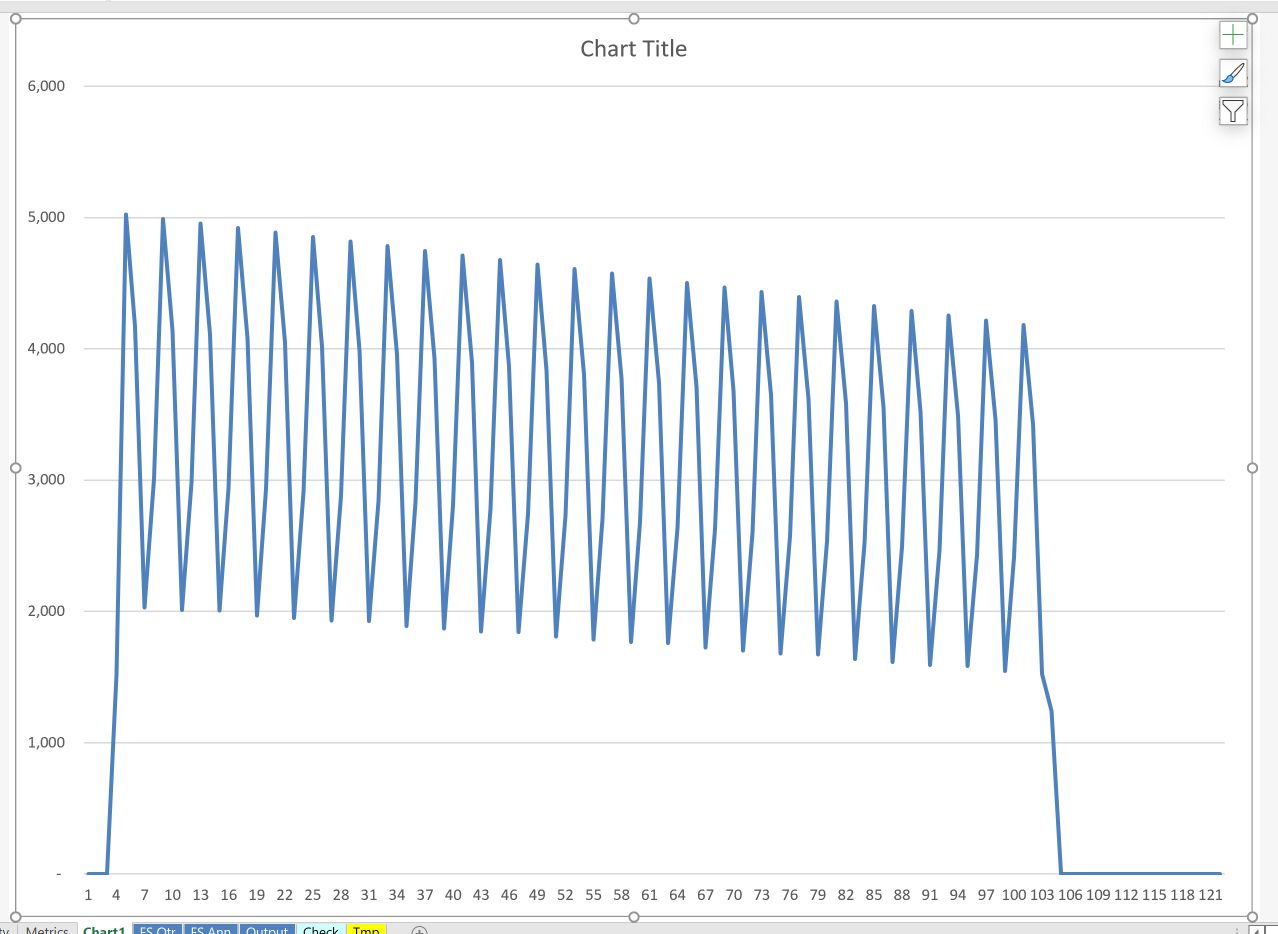
Our current debt repayment profile looks like the chart below.
Note that in the charts, CFADS stands for "Cash flow available for debt service".
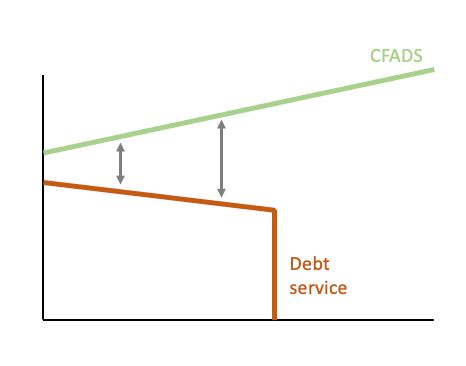
With level principal repayment, our debt service is downward sloping.
If we had an "amortising" or "mortgage-style" repayment profile, we would have level debt service. In concept, this would look like this:
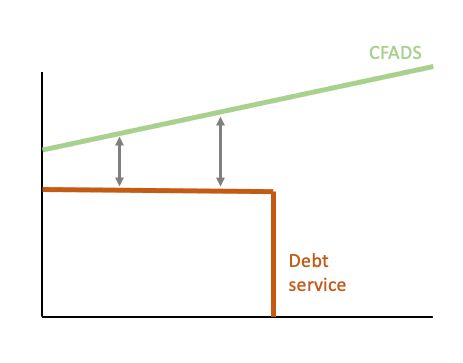
The arrows represent the additional cash flow in the period that the business can distribute after it has paid its debt. If it can pay less debt service in the earlier years and more debt service in the later years, the business could increase the amount of cash available for distribution in the early years. This would be good news for shareholders.
We can take this further with "sculpted" repayments, where we size the repayment in each period to match the profile of cash flow available.
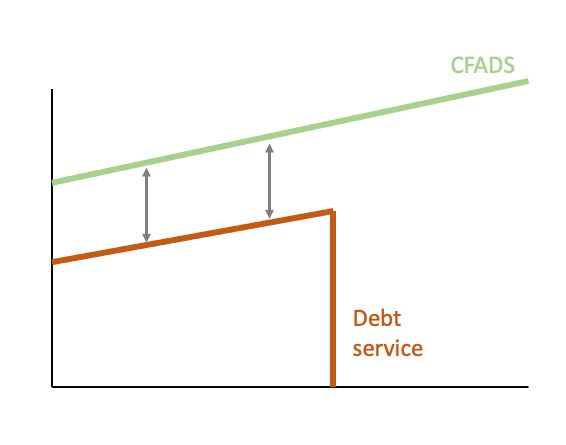
In concept, this would further increase the cash available in the early years and would be good for IRR.
We are going to look at both of these in turn.
Quick review of the financial statements before we move on
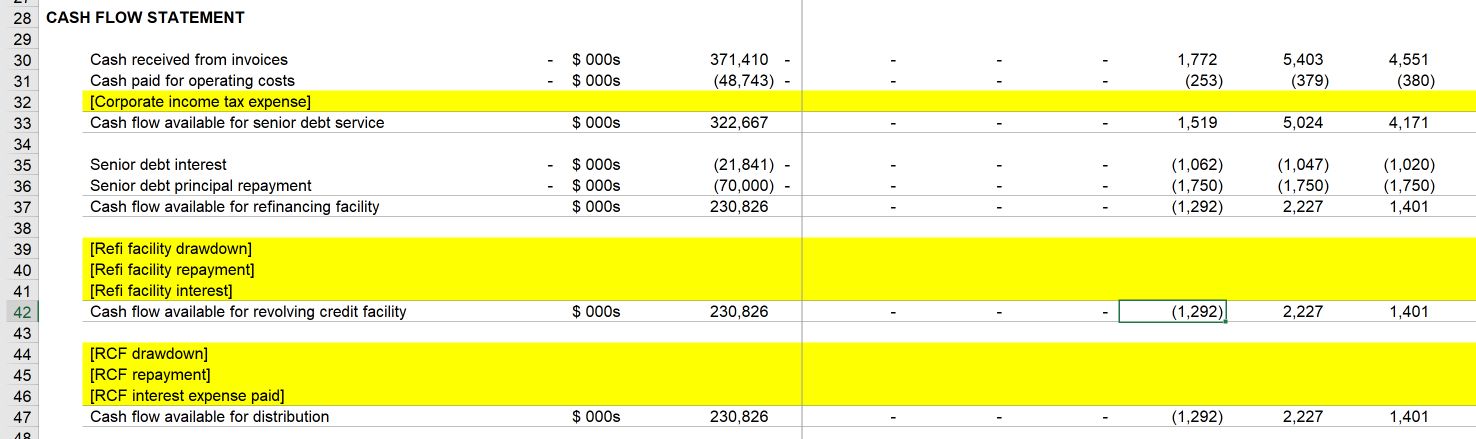
Before we do, since we’ve completed a significant step in our modelling, it's worth taking a quick look at the financial statements.
We can see a cash shortfall in the early periods. This means insufficient cash to meet our debt service obligations in those periods.
Whenever I catch something in the model that I want to understand better I’ll usually quickly go to a quick chart of the line item in question.
To quickly show a chart of CFADS and debt service together, first select the line on the cash flow statement (row 33) and hit F11:
Then select debt service on the debt sheet, copy the line with Ctrl+c, return to our chart and "paste" the new line into the chart with Ctrl+v. This is a quick and very efficient way of showing multiple lines on a chart to be able to compare:
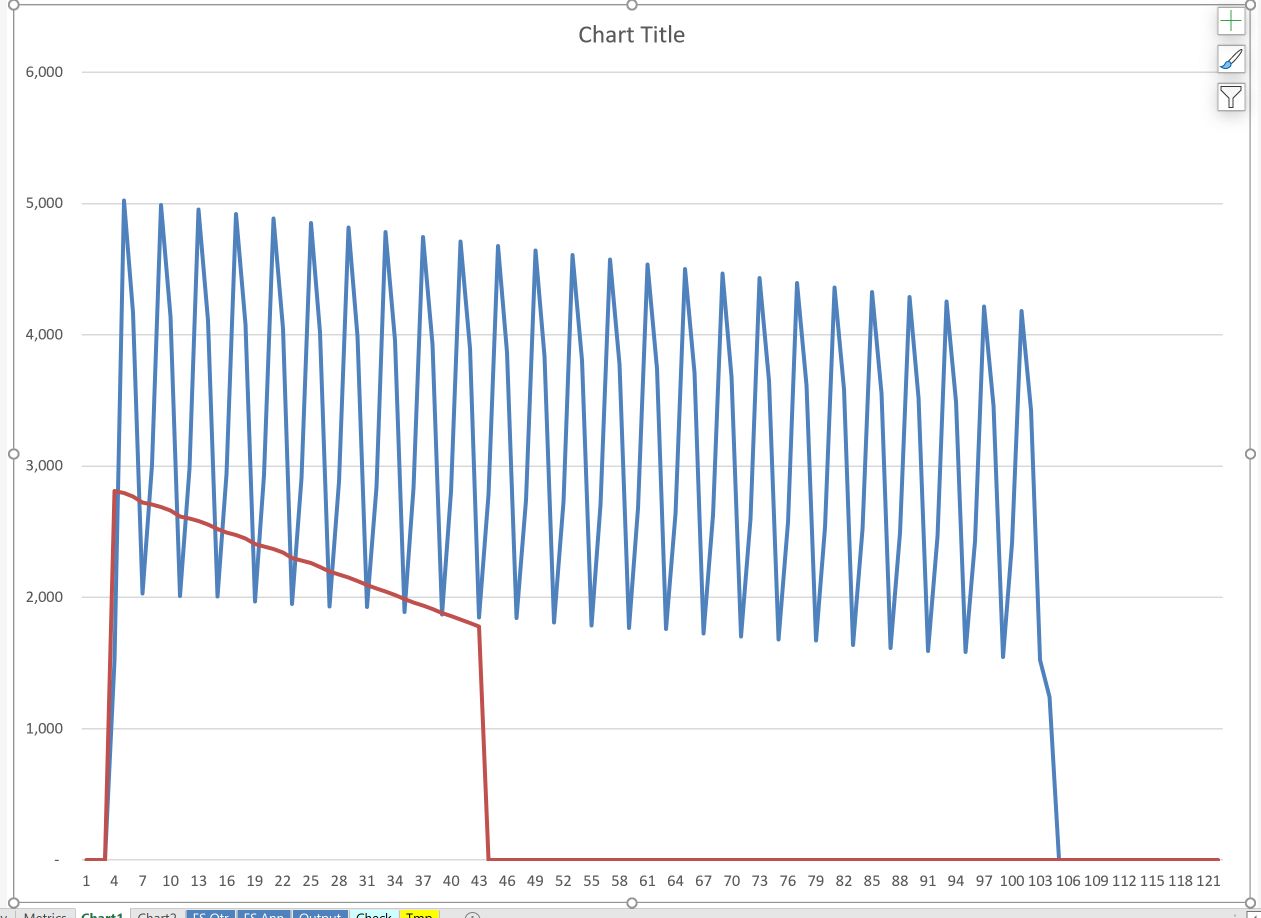
What’s going on here?
Due to the highly seasonal nature of our revenues, there are specific periods when there is insufficient cash flow to pay debt service. (Note: I have made the season variation in revenue extremely wide for this training model to illustrate the point.)
Additionally, the working capital requirement in the first period means that the shortfall is greatest in that period.
What happens if there is insufficient cash to pay the debt? At present, the model "assumes", somewhat by default, that we can obtain a free overdraft. If we chart our retained cash balance, we see the following:
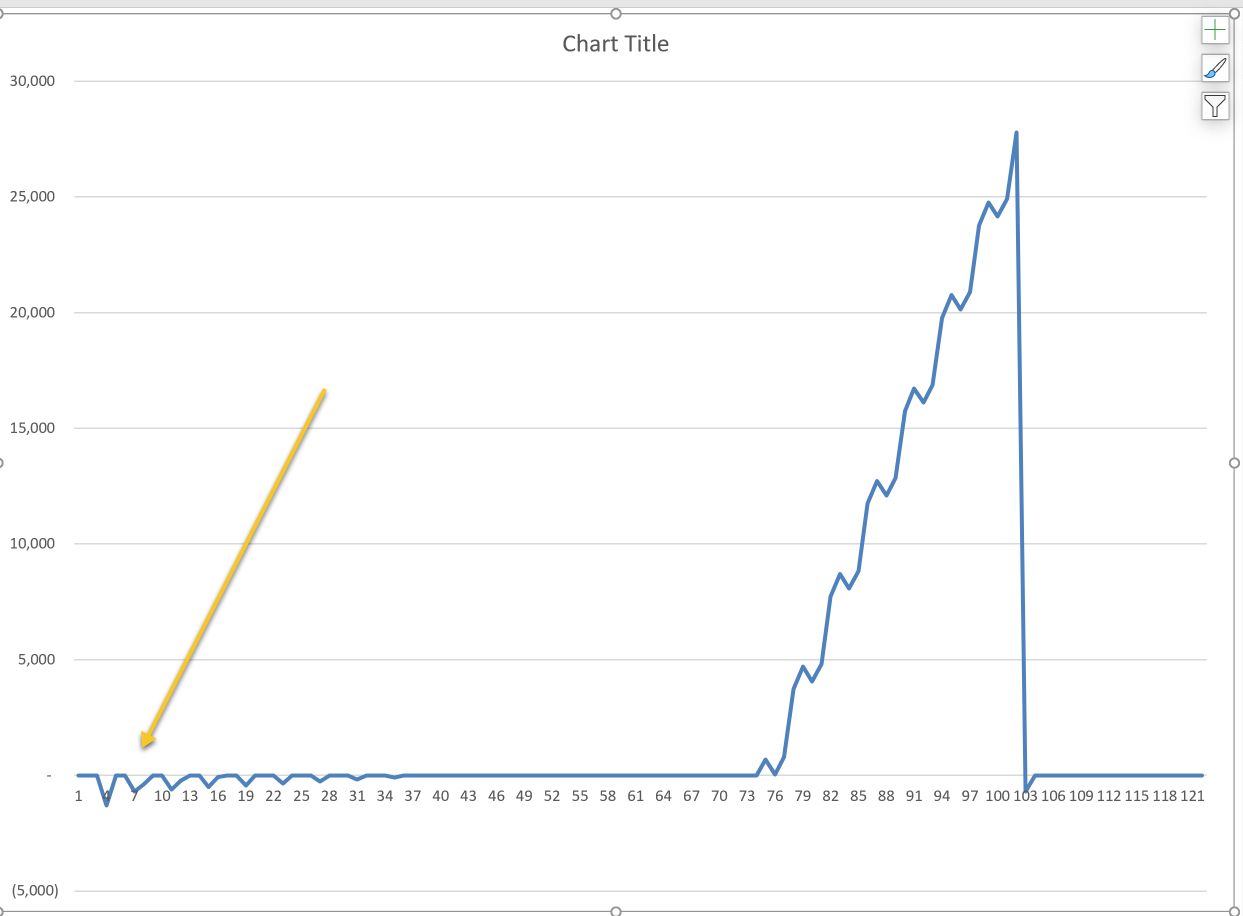
We have negative retained cash in the early periods. In effect, the model assumes a "free overdraft" facility to finance debt service.
There are clearly some structural issues that we are going to have to address. As we work on modelling the other repayment profiles, we’ll keep an eye on this cash shortfall problem.
Download the file with the above charts added:
To obtain the worked example file to accompany this chapter buy the financial modelling handbook.

Comments
Sign in or become a Financial Modelling Handbook member to join the conversation.
Just enter your email below to get a log in link.